Data pipelines are the backbone of modern, data-driven enterprises. They enable the flow of data from an ever-growing number of sources, transforming it to make it suitable for analysis. But errors can occur as your data moves from one system to another, so monitoring them is crucial.
Here are five key things to know about data pipeline monitoring tools:
- Data pipeline monitoring tools ensure data quality and operational efficiency.
- The periodic review and monitoring of data pipelines can help ensure they remain compatible with new data types and formats.
- Data pipeline monitoring tools also provide valuable insights into your data pipelines, enhancing business intelligence.
- There are many data pipeline monitoring tools available, including Integrate.io, Fivetran, Stitch, and more.
- The best pipeline monitoring tools offer integrations with your tech stack, features such as data flow tracking, and the ability to scale with your business.
In this guide, we’ll cover ten of the best data pipeline monitoring tools that can help you manage the performance and health of your data pipelines.
What Are Data Pipeline Monitoring Tools?
Data pipeline monitoring tools are platforms designed to oversee the performance and health of data pipelines.
These tools are essential in maintaining data quality and reliability by continuously tracking data flow, identifying potential bottlenecks, and alerting users to anomalies or errors during data processing.
Most data pipeline tools have an integrated data monitoring component with varying degrees of complexity.
How to Evaluate Data Pipeline Monitoring Tools
Selecting the right data pipeline monitoring tool is crucial for maintaining the health and efficiency of your data operations. Here are the key factors to consider when evaluating data pipeline monitoring tools.
Compatibility and Integration
The data pipeline monitoring tool you choose must be compatible with your existing data pipeline infrastructure and easily integrate with the data sources and storage systems you use. It must also be capable of handling different data formats.
Features and Functionality
Look for tools that provide comprehensive monitoring capabilities, such as real-time data flow tracking, performance metrics, anomaly detection, and error logging.
A user-friendly interface and robust visualization capabilities are also crucial for helping users understand and interpret the data pipeline's performance and health at a glance.
Scalability and Performance
Choosing a monitoring tool that can scale with your data operations is vital. Assess the tool's ability to handle increasing data volumes, pipeline complexity, and the number of users without compromising performance or accuracy.
1. Integrate.io
Rating: 4.3/5 (G2)
Key Features:
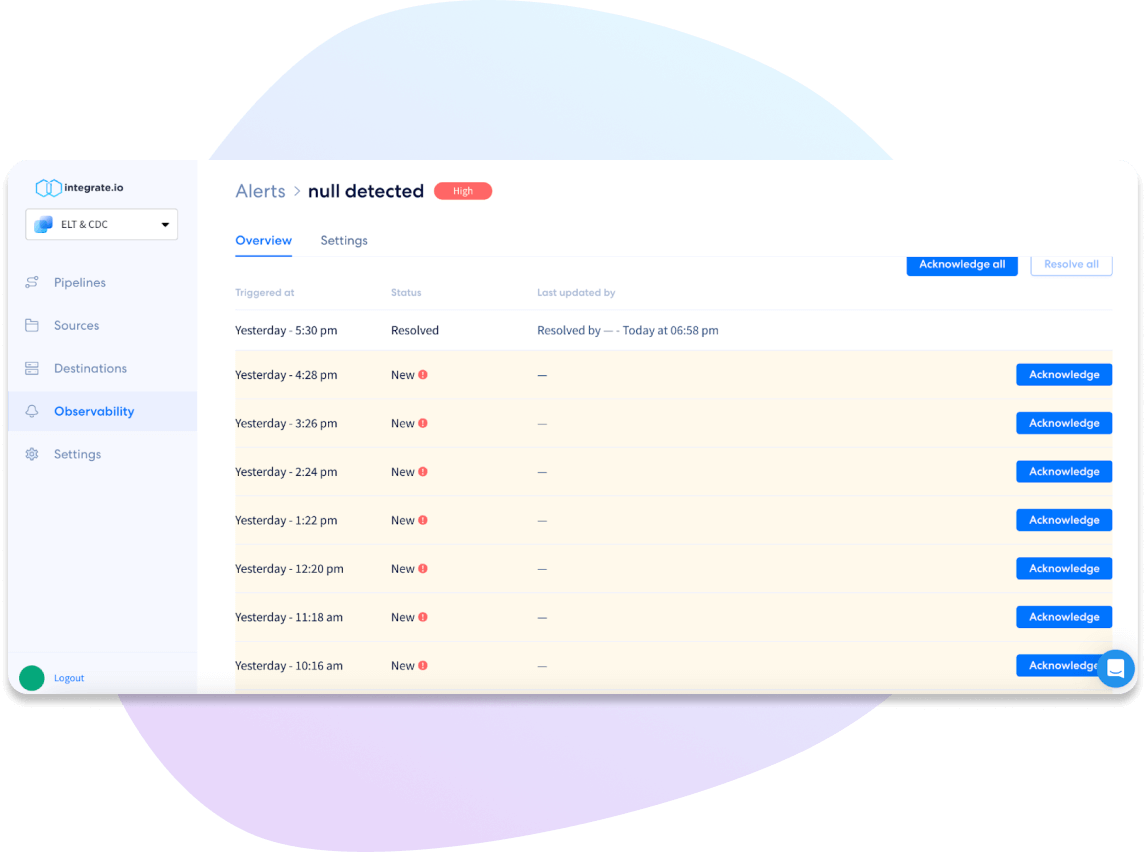
- Data monitoring: Comprehensive monitoring capabilities provide real-time visibility into data pipeline performance and health.
- Data alerts: Customizable alerts keep you informed about critical events and issues for proactive issue resolution.
- Hundreds of pre-built connectors: Simplify integration with various data sources and destinations for seamless data movement.
- ETL and ELT: Supports Extract, Transform, Load (ETL) and Extract, Load, Transform (ELT) processes for flexible data integration and transformation.
- CDC: Change Data Capture (CDC) functionality enables efficient tracking and synchronization of data changes from source to target systems.
Integrate.io is a powerful, no-code/low-code data integration and monitoring platform with comprehensive data pipeline management capabilities. Its data observability feature provides real-time visibility into your data pipeline's performance and health, allowing you to identify and address issues quickly.
The platform's support for both ETL and ELT processes allows for flexible data integration and transformation. At the same time, its CDC functionality ensures that target systems are always up-to-date with the latest data changes.
One of Integrate.io’s key differentiators is that even non-technical users can quickly create a complex data pipeline in minutes due to its no-code/low-code capabilities and hundreds of pre-built data connectors.
Integrate.io pricing is tailored exactly to each client's needs and requirements with a usage-based component couple with features and functionality. Clients choose which level of platform usage they will require and then which features and functionality to create a custom plan to fit their use case.
2. Fivetran
Rating: 4.2/5 (G2)
Key Features:
- Automated data governance: Ensures teams have the visibility and control to manage their data assets effectively.
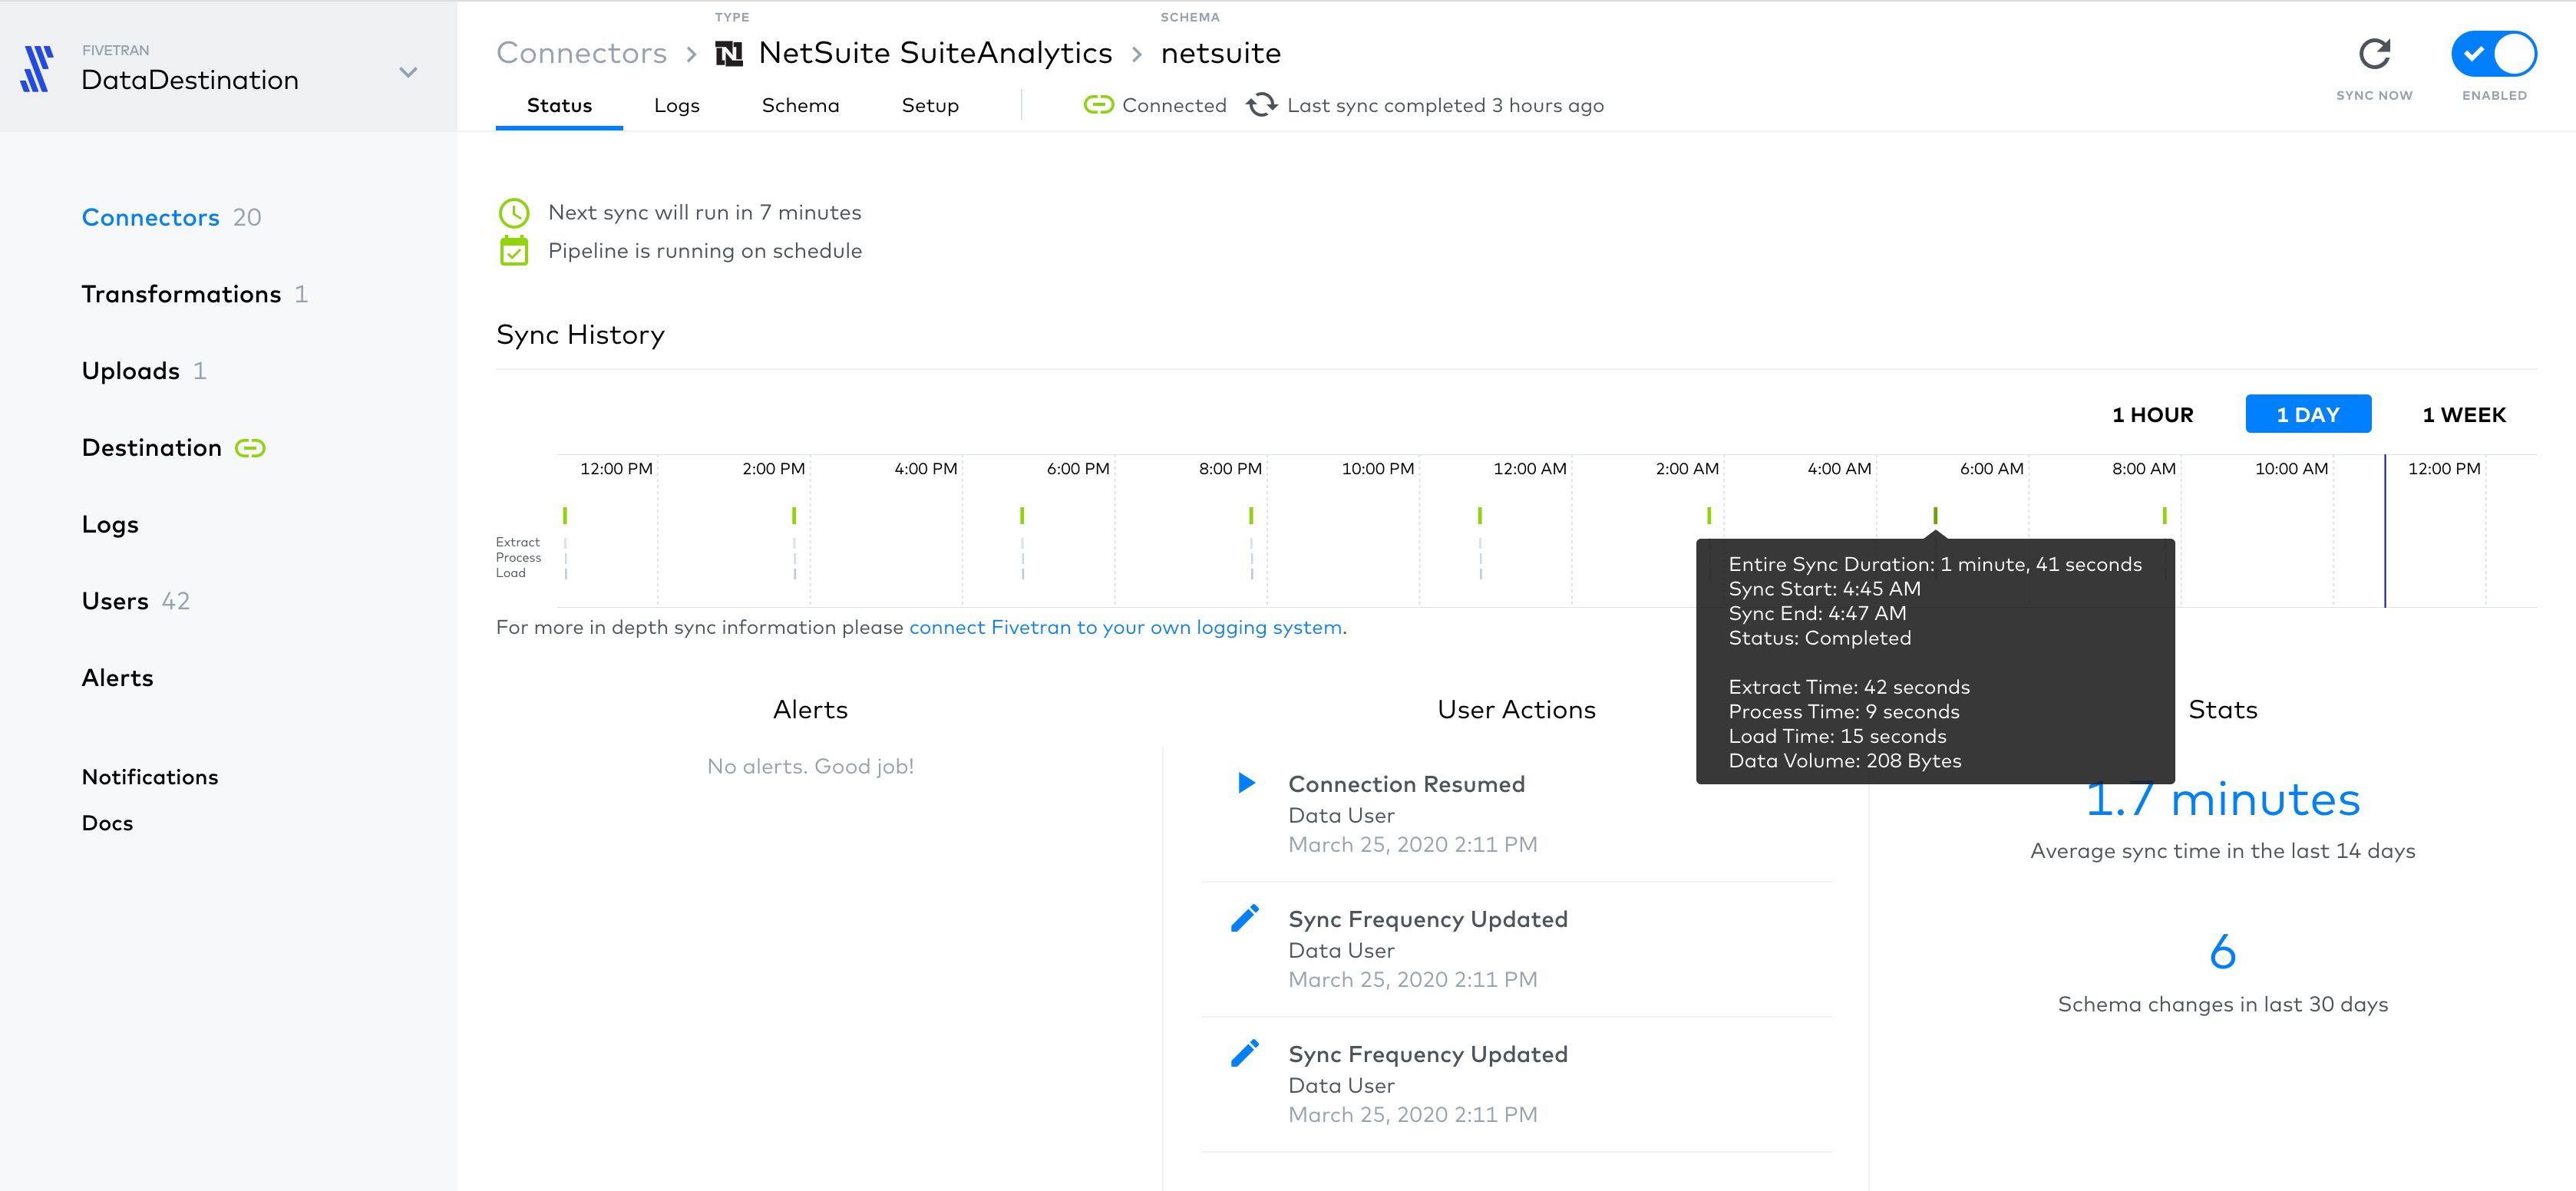
- Data lineage graph: Monitor data movement, logs, and statuses from extraction to warehouse load.
- Centralized alerts and notifications: Manage connector and transformation alerts in Fivetran for simplified troubleshooting.
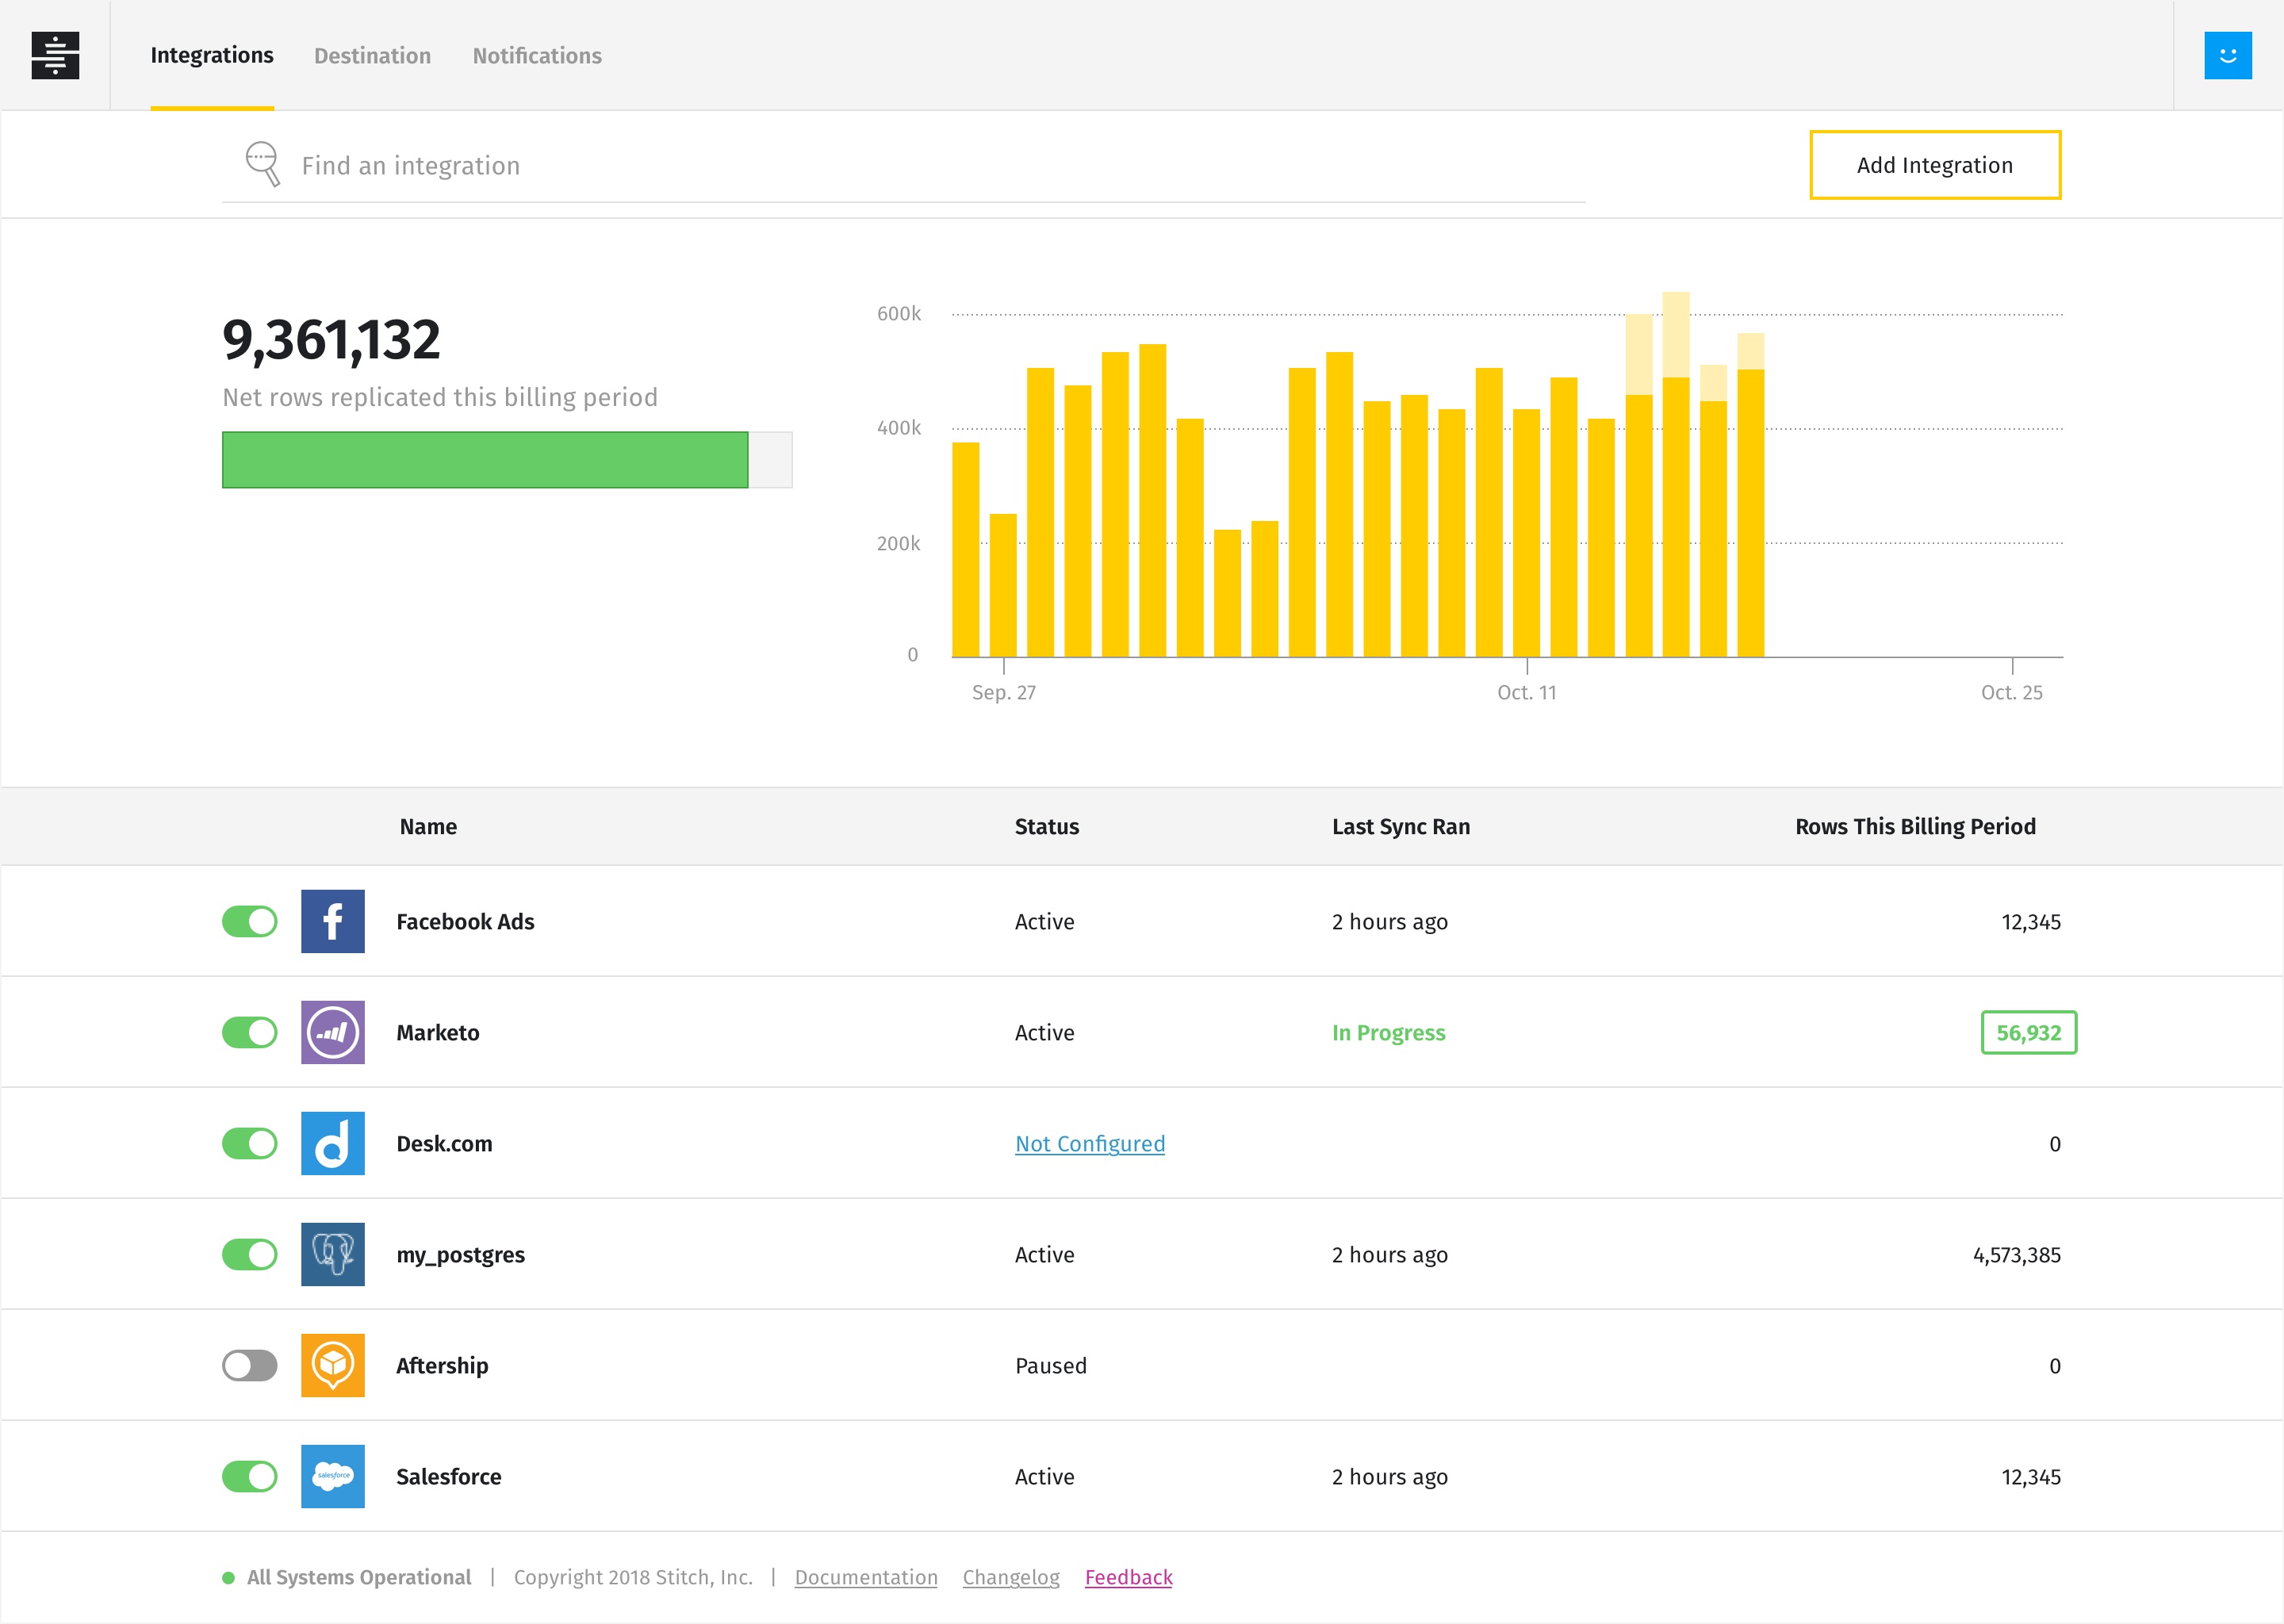
Fivetran is a powerful data integration platform with data movement and management capabilities. Its data lineage graph allows users to monitor data movement and status throughout the pipeline, providing full visibility and control.
At the same time, integrated scheduling and centralized alerts and notifications streamline orchestration and troubleshooting for a seamless user experience.
You can use Fivetran for free if you work with small volumes of data. Otherwise, you'll need to reach out to Fivetran for more pricing details.
3. Hevo
Rating: 4.3/5 (G2)
Key Features:
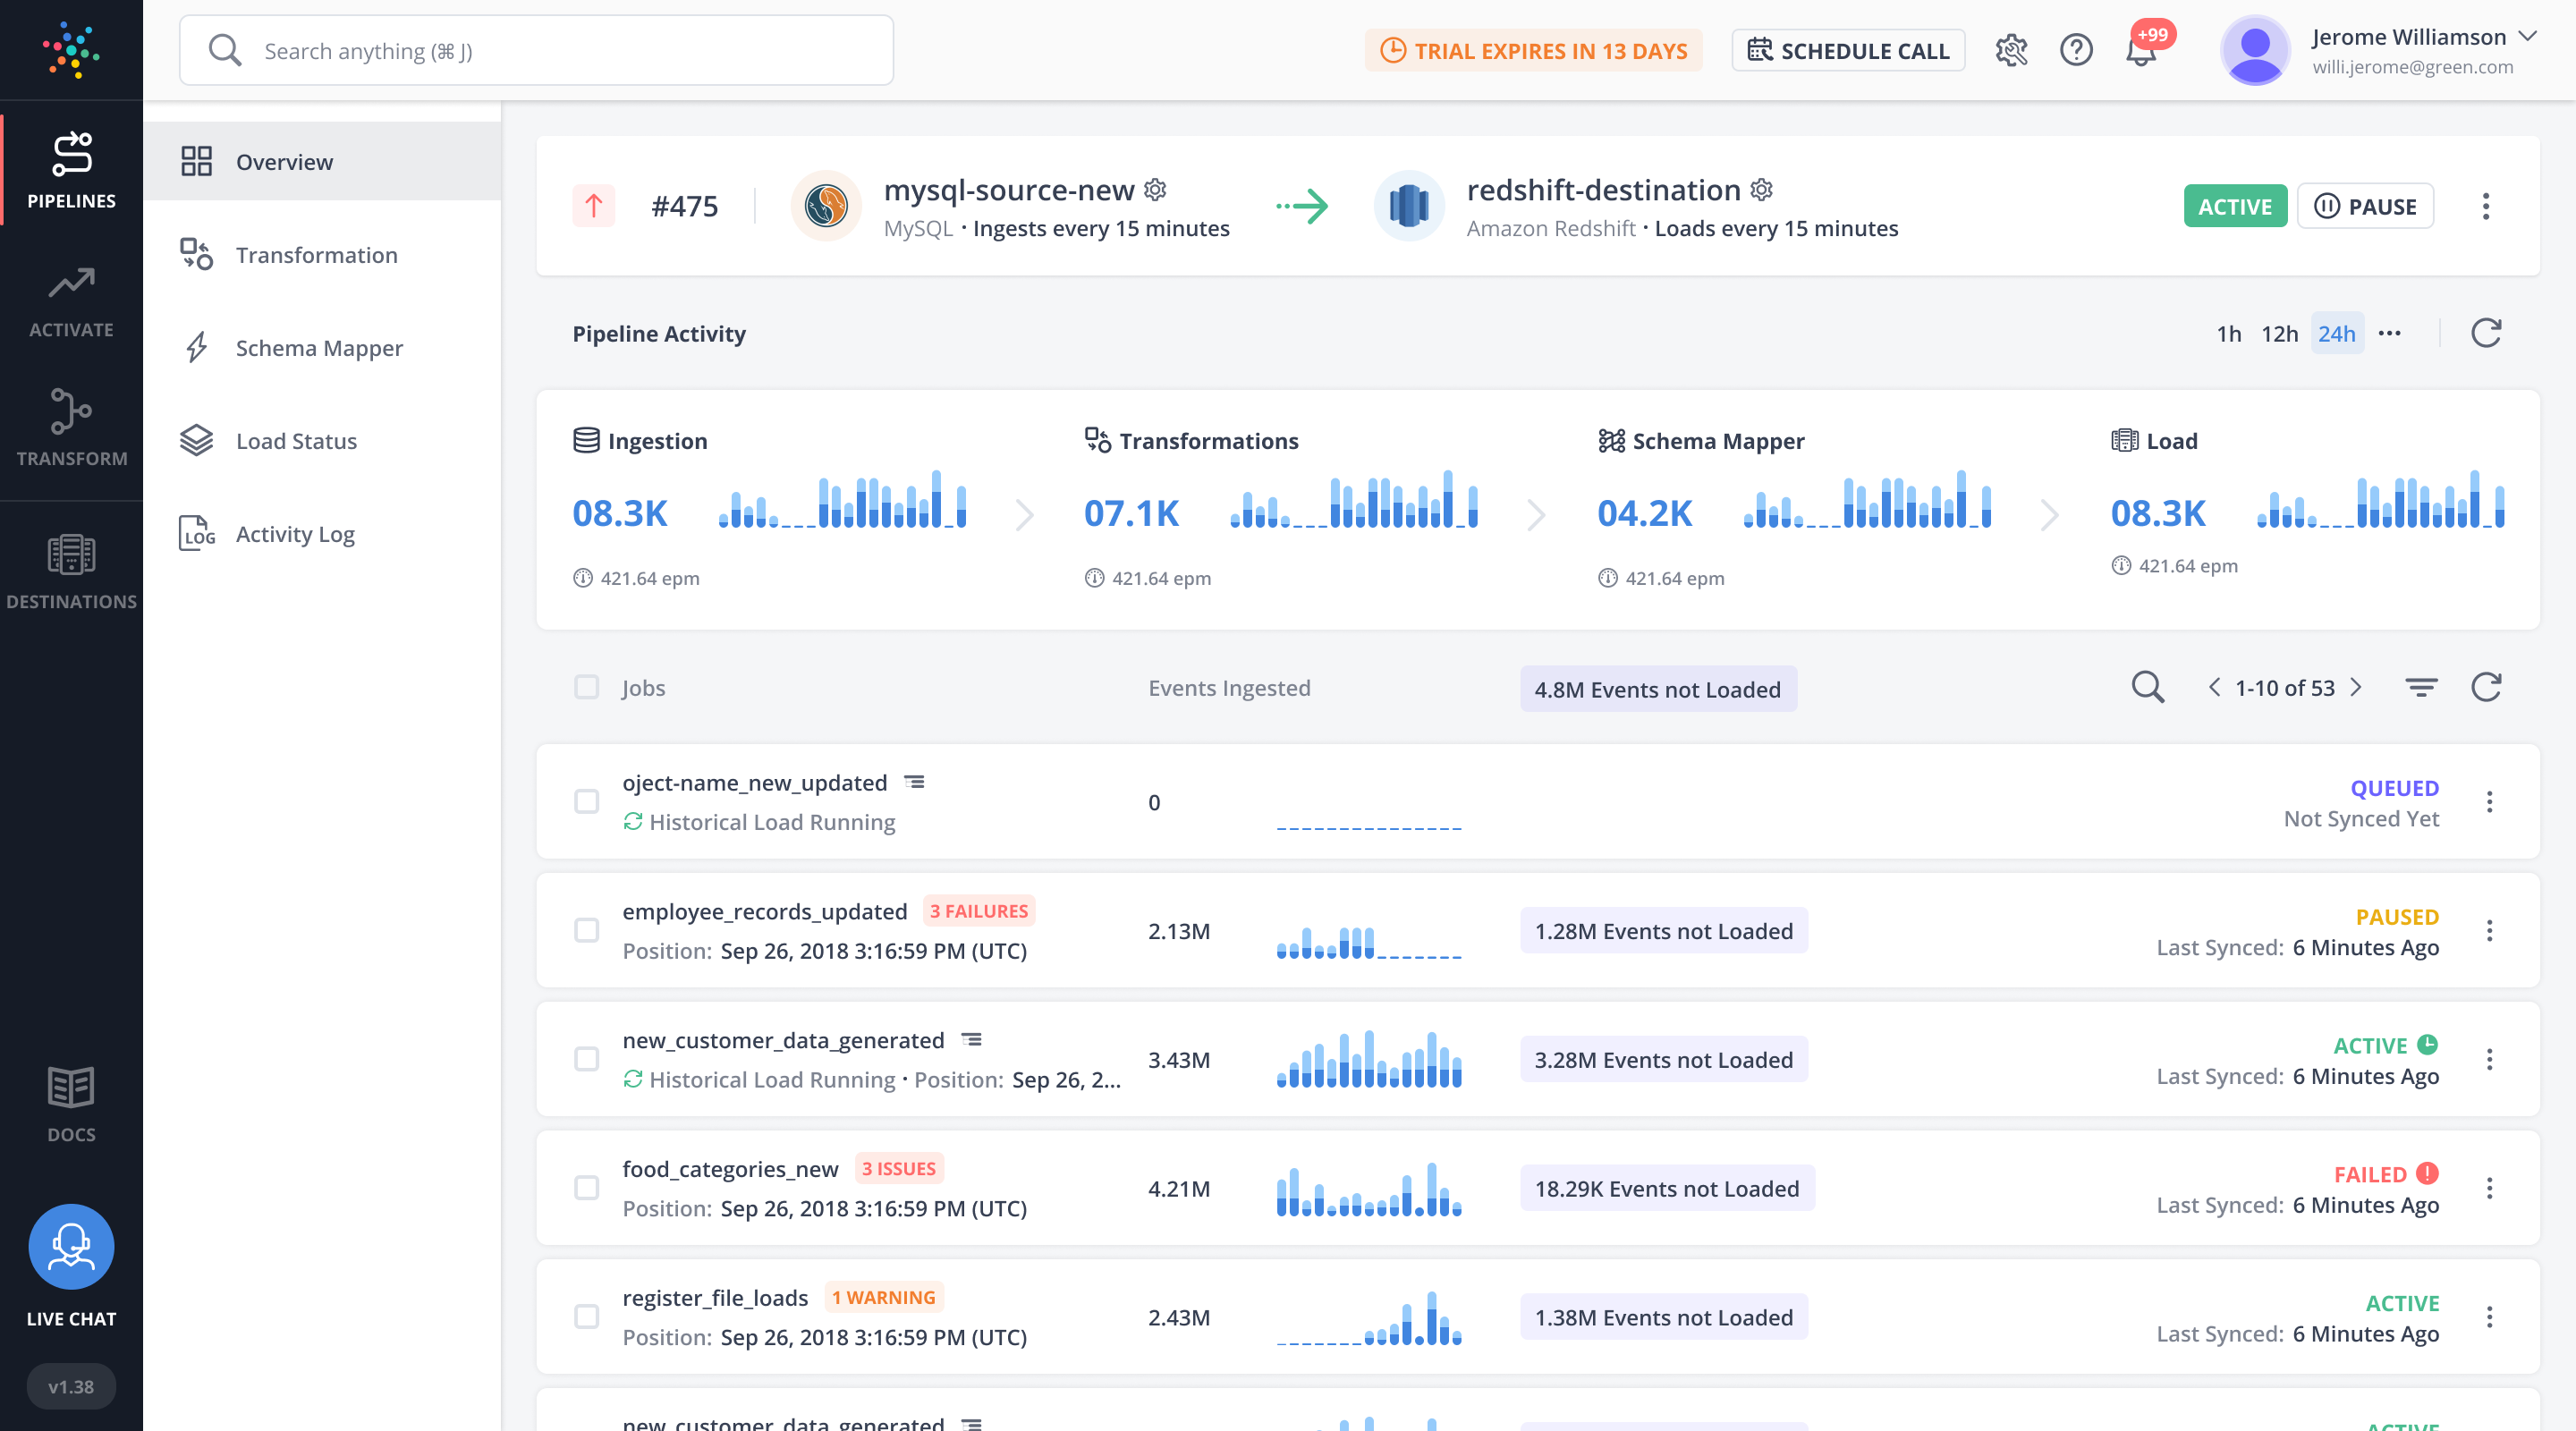
- Intuitive dashboards: Monitor pipeline health, failures, and real-time data flow for improved visibility and control.
- Automated pipelines: Easily set up and maintain pipelines for 150+ data sources without manual intervention.
- Preload transformations: Format data on the fly and override auto schema mapping for precise control over data loading.
Hevo is a versatile data integration platform that simplifies setting up and maintaining end-to-end data pipelines. Its intuitive dashboards provide complete visibility into pipeline health, offering total control over your pipelines.
Moreover, the platform’s fault-tolerant architecture ensures high reliability, zero data loss, low latency, and end-to-end encryption for maximum security.
You can try Hevo's free plan if you use a small volume of data. If you need more functionality, paid plans start at $239 per month.
4. Stitch (by Talend)
Rating: 4.5/5 (G2)
Key Features:
- Data quality: Profile, cleanse, and mask your data while monitoring data quality over time.
- Low maintenance pipelines: Stitch pipelines update automatically and continuously, reducing the need for ongoing maintenance.
- 140+ built-in connectors: Connect to various data sources without writing code.
Stitch is a powerful data integration platform that saves engineering time, enabling users to extract data from 140+ popular sources without coding. The platform works alongside other Talend solutions to ensure data quality across all integrations allowing users to profile, cleanse, and mask data regardless of format or size.
With Talend, Stitch also offers additional features such as parsing technology for unstructured data, data masking, and customizable dictionaries for auto-discovering data.
Stitch offers three pricing plans to choose from, including Standard, Advanced, and Premium.
5. Gravity Data
Rating: 5/5 (G2)
Key Features:
- Real-time monitoring: Gain real-time visibility into your data pipelines.
- Automated notifications: Receive status updates via Slack, Teams, and Webhooks.
- Extensive connectors: Gravity Data features over 110 built-in connectors, including APIs, databases, files, and more.
Gravity Data is a data integration platform that simplifies data management. The platform ensures reliable, high-throughput data pipelines from both streaming and historical sources, while its real-time monitoring capabilities provide full visibility into pipeline health.
Pricing plans start at $299 per month, but a free plan with limited functionality is also available.
6. Splunk
Rating: 4.3/5 (G2)
Key Features:
- ML and AI: Leverage machine-level intelligence to predict and prevent issues, improving security and business outcomes.
- Data streaming: Collect, process, and stream data to Splunk and other destinations quickly with real-time processing.
- Powerful dashboards: Create intuitive and informative dashboards to communicate complex data stories.
Splunk is a data analytics platform incorporating machine learning and AI to deliver intelligent insights, improving security and business outcomes. Its real-time data streaming functionality enables it to collect, process, and distribute data within milliseconds.
The platform provides real-time actionable alerts, centralized enterprise controls, and AI-driven analytics, allowing users to confidently scale and troubleshoot across thousands of microservices and billions of events.
Splunk does not disclose its pricing, so you must contact them for a custom quote.
7. Mozart Data
Rating: 4.5/5 (G2)
Key Features:
- Data pipeline observability: Observe your entire data pipeline with clear views of dependencies between tables and transforms.
- Faster troubleshooting: Quickly identify issues in the pipeline with helpful indicators.
- Seamless data integrations: Access and integrate data from various sources, including databases and third-party applications.
Mozart Data is a data management platform that provides clear views of your entire data pipeline, allowing you to observe dependencies between tables and transforms. This allows for faster troubleshooting and helps you identify issues in the pipeline more efficiently.
Mozart Data offers a free plan. Paid plans start at $1,000 per month with a $1,000 implementation fee.
8. Monte Carlo
Rating: 4.7/5 (G2)
Key Features:
- End-to-end coverage: Instantly notify specific data team owners when data incidents occur, facilitating rapid resolution.
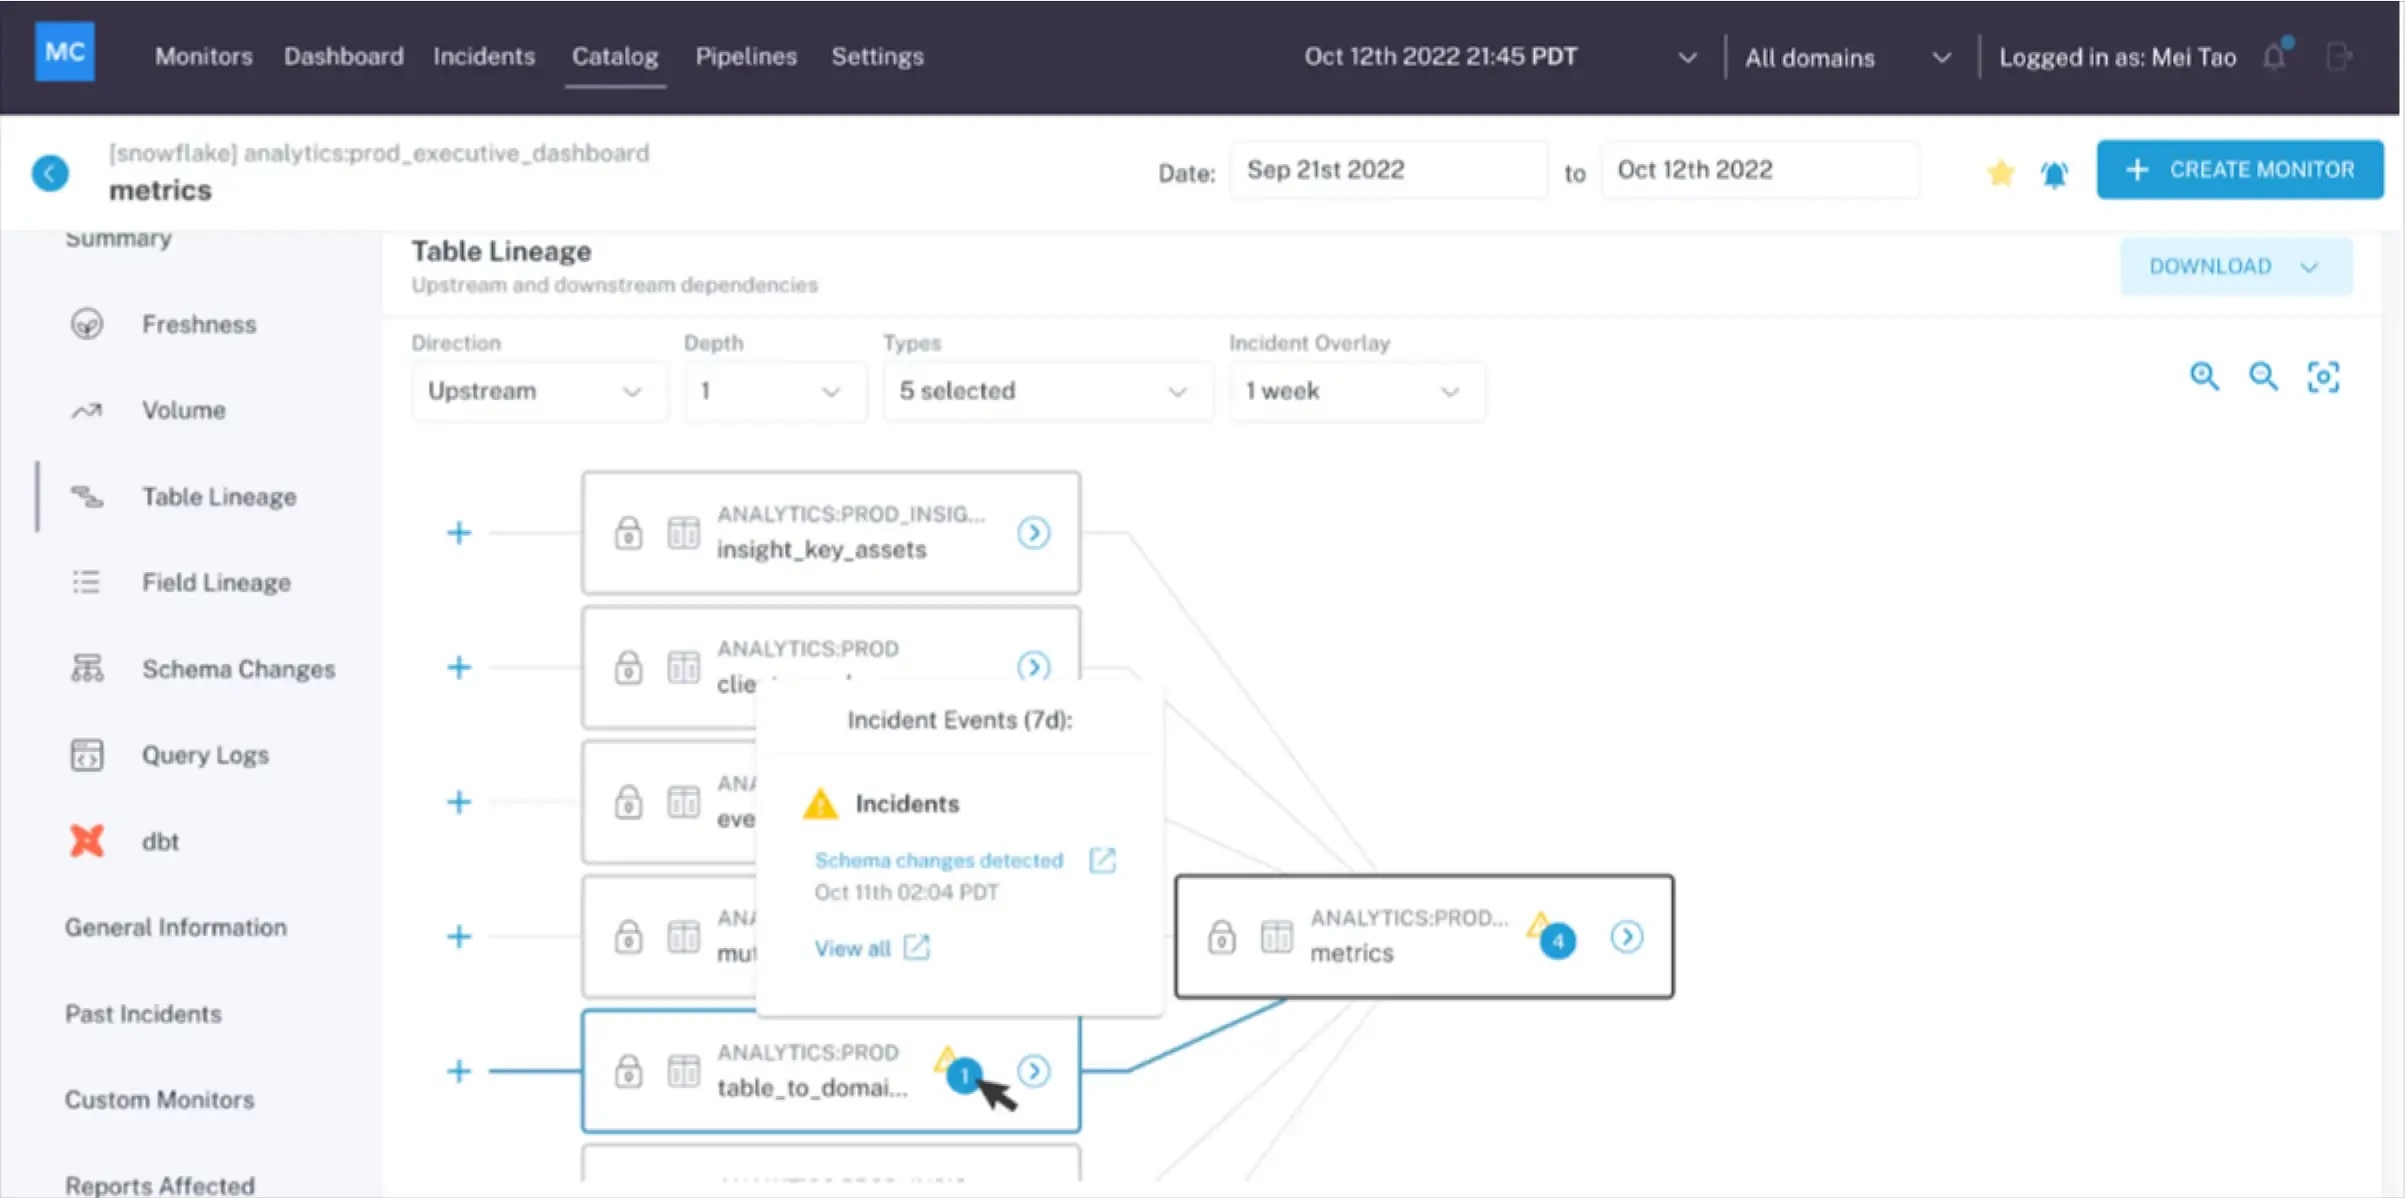
- Automated field-level lineage: The platform offers complete and up-to-date field lineage within 24 hours of deployment, enabling full visibility of upstream sources and downstream dependencies.
- Secure and efficient deployments: Monte Carlo is a SOC 2 Type 2 certified platform that monitors data-at-rest, extracting only metadata, query logs, and aggregated statistics for efficient computation.
Monte Carlo is a data observability platform providing end-to-end coverage and instant notifications for better data visibility. It fosters efficient root cause analysis across your data stack and is SOC 2 Type 2 certified, ensuring security while monitoring data at rest.
This makes it an efficient solution for businesses that need reliable, automated, and secure data management. Monte Carlo does not disclose its pricing, so you must contact them for a custom quote.
9. Acceldata
Rating: 4.4/5 (G2)
Key Features:
- End-to-end visibility: Provides insights into data assets and pipelines from start to finish for proper data delivery and timeliness.
- Root cause identification: Uses data lineage to trace transformation failures and data inaccuracy across tables and columns.
- Data incident detection and resolution: Applies multi-layer data to identify incidents, isolate problems, and take corrective actions.
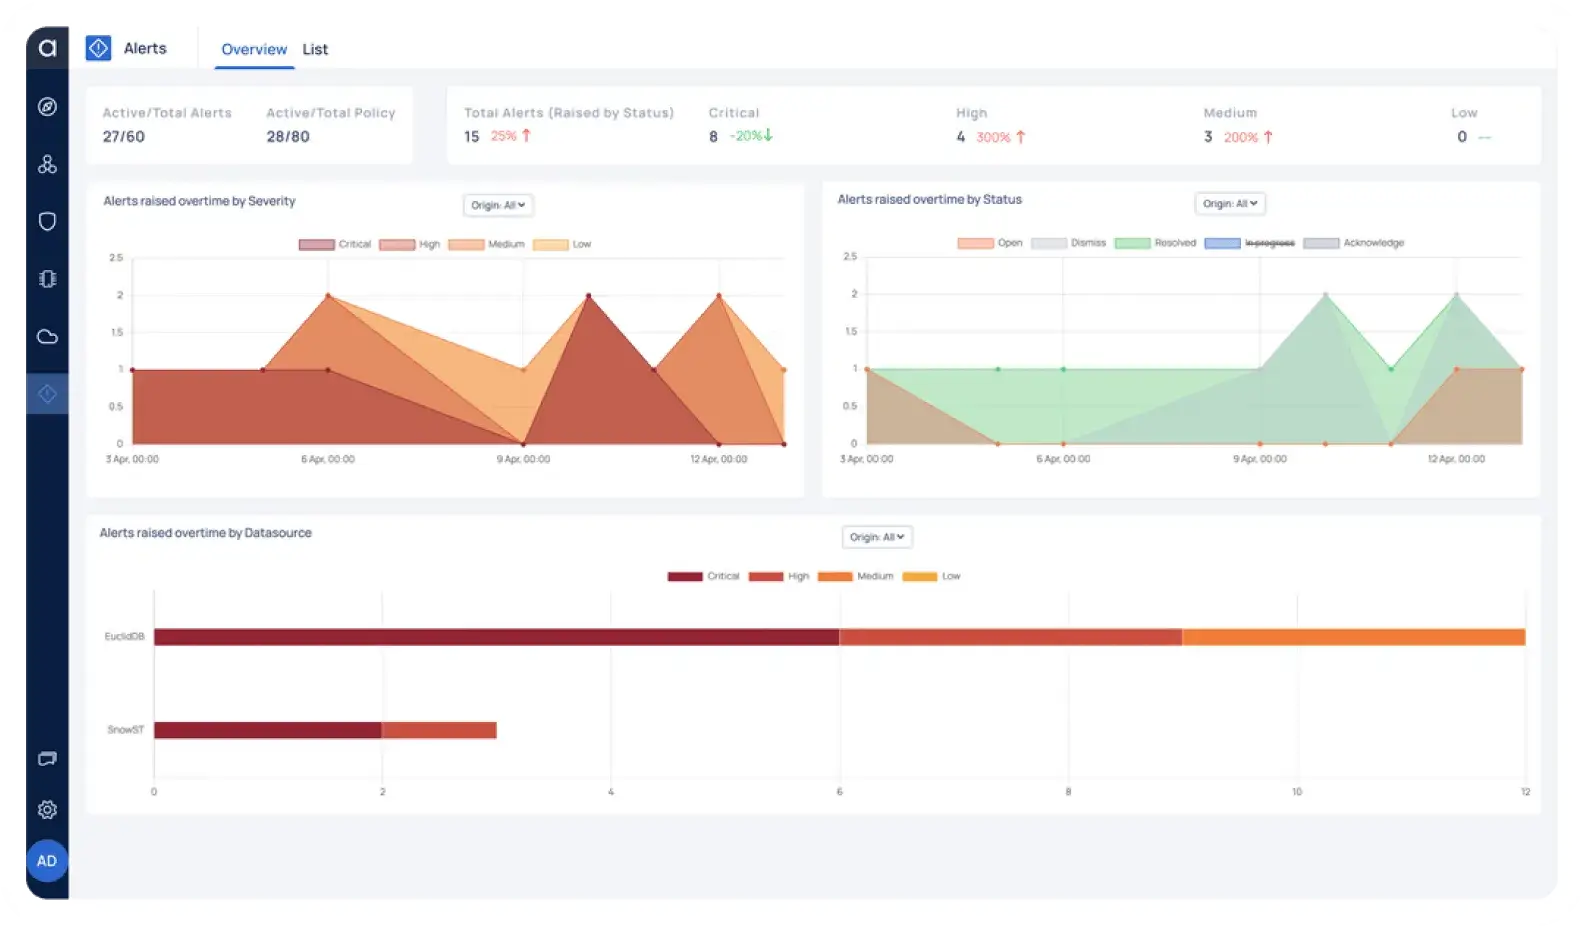
Acceldata is a data observability platform that optimizes data quality and prevents data outages. It offers end-to-end visibility of data assets and pipelines, ensuring proper delivery and timeliness of data.
The platform helps identify the root cause of data issues with data lineage, allowing users to trace transformation failures and data inaccuracies across tables and columns.
Pricing information for Acceldata is not publicly available, so you must contact their sales department for a custom quote.
10. Datadog
Rating: 4.3/5 (G2)
Key Features:
- Log data analysis: Allows quick search, filtering, and analysis of logs for troubleshooting and data exploration with automated tagging and correlation.
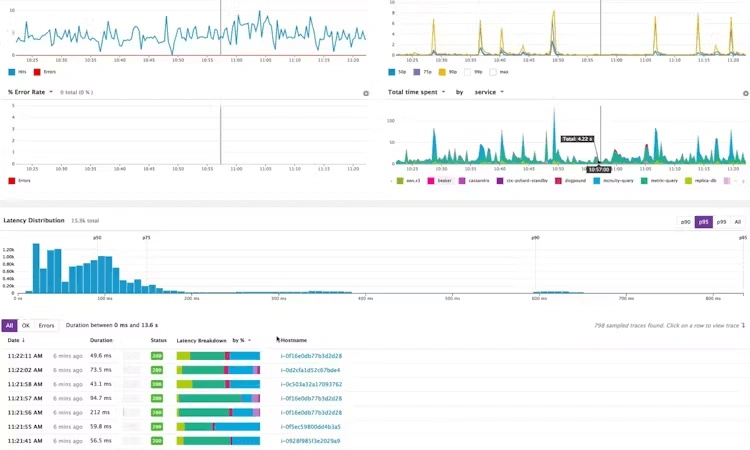
- Customizable dashboards: Build real-time interactive dashboards that visualize metrics and events from your data pipelines, allowing you to monitor and analyze pipeline performance and health.
- Built-in integration: Datadog integrates with popular data processing platforms, enabling you to monitor your data pipelines more effectively.
Datadog provides complete visibility into systems, applications, and services. The platform’s data pipeline monitoring features allow you to maintain visibility into the performance and health of your data pipelines, ensuring quick identification and resolution of any issues that may impact data quality.
Datadog offers various pricing options depending on your needs. For example, database monitoring starts at $70 per database host/month.
Simplify Data Pipeline Monitoring With Integrate.io
Integrate.io is a cloud-native data integration platform that simplifies data pipeline monitoring and management. Compared to other solutions, Integrate.io’s low-code/no-code interface allows data teams to efficiently build and monitor data pipelines without extensive technical expertise.
Request a demo today and see how easy it is to create, manage, and monitor data pipelines with Integrate.io.
Data Pipeline Monitoring FAQs
What Is Data Pipeline Monitoring?
Data pipeline monitoring is the process of tracking and overseeing a data pipeline's operational health and performance. Monitoring can involve ensuring that data is moving through the pipeline correctly and detecting errors or issues that could cause data loss or corruption.
Why Is Data Pipeline Monitoring Important?
Data pipeline monitoring helps identify any inconsistencies, errors, or anomalies in the data, ensuring that only accurate and reliable data reaches the end users or systems. Moreover, regular monitoring can help ensure compliance with data regulations and standards.
What Are the Metrics for Data Pipeline Monitoring?
Data pipeline monitoring involves key metrics such as latency, traffic, error and success rates, throughput, data freshness, and CPU and memory usage.
