Dow Jones & Company is a publishing and financial information firm with products and services that help businesses participate in the market better. Examples are Barron’s, Factiva and also the Wall Street Journal. They serve enterprises and consumers alike.
Colleen Camuccio is a VP of Program Management at Dow Jones. In her presentation at AWS re:Invent she talks about Dow Jones’ use of the AWS and Amazon Redshift. Amazon Redshift is at the centre of their stack to turn their data system from a cost center to a revenue generating center.
In this post, we’re providing a summary of how Dow Jones implemented their new data platform with Amazon Redshift at the center of it.
A struggle for data
Large companies don’t often start brand new projects from scratch, so why did Dow Jones decide to create a brand new data platform from the ground up?
At Dow Jones, data users faced five problems when working with data.
- Multiple versions of the truth
- Limited visibility into performance
- Wasted time spent hunting data
- Missing insights impairs decision making
- Inability to segment
 Pre-cloud data challenges at Dow Jones
Users couldn’t get their hands on the data they wanted to get to. With these problems in mind, Colleen and her team saw an opportunity. That opportunity was to use the cloud, and turn data from a cost center into a revenue generating center by creating a brand new, world class data platform.
Designing the new data platform
To plan the architecture, and choose all of the tools involved in creating their data platform, the team created a council of cloud technologists. The council includes experts from inside Dow Jones, industry specialists, and members from AWS to help design the architecture of the new platform.
 Dow Jones Data Platform Reference Architecture
There are five core AWS technologies that serve as the foundation for the architecture:
- S3 as the data lake
- EC2 to pull data into S3
- EMR and Spark to process data
- AWS Glue to organize and partition data
- Amazon Redshift as the analytics platform
These five technologies form the backbone of the Dow Jones data pipeline.
S3 as the data lake
S3 is the staging area to source, standardize and catalog data. The goal is to collect, clean and key every relevant customer event for downstream usage. Data in S3 is transformed into Parquet and normalized for consumption by self-service tools and analytics use cases.
EC2 to pull data into S3
Not all systems Dow Jones works with are able to drop data directly into the platform via e.g. off-the-shelf ETL tools. To solve this issue of data sourcing, EC2 instances pull data from servers, APIs, and 3rd party sources.
EMR and Spark to process data
Amazon EMR is an AWS framework for processing big data workloads. EMR allows you to store data in S3 and run computation in a separate process. EMR provides native support for Apache Spark. The decision when to use Spark vs. Redshift to process data depends on the use case.
Dow Jones uses EMR to process, massage, and transform data, with different S3 buckets for the individual steps and stages.
 Data Lake Areas and S3 Buckets
AWS Glue to organize and partition data
End users access “data marts”, i.e. aggregated data with business rules applied. An example is a “demographic data mart”, where Dow Jones summarizes and exposes single-user profiles (e.g. cleaned for different job titles for the same customer).
To label, organize and partition data for intuitive downstream access from S3, Dow Jones uses AWS Glue.
Amazon Redshift as the analytics platform
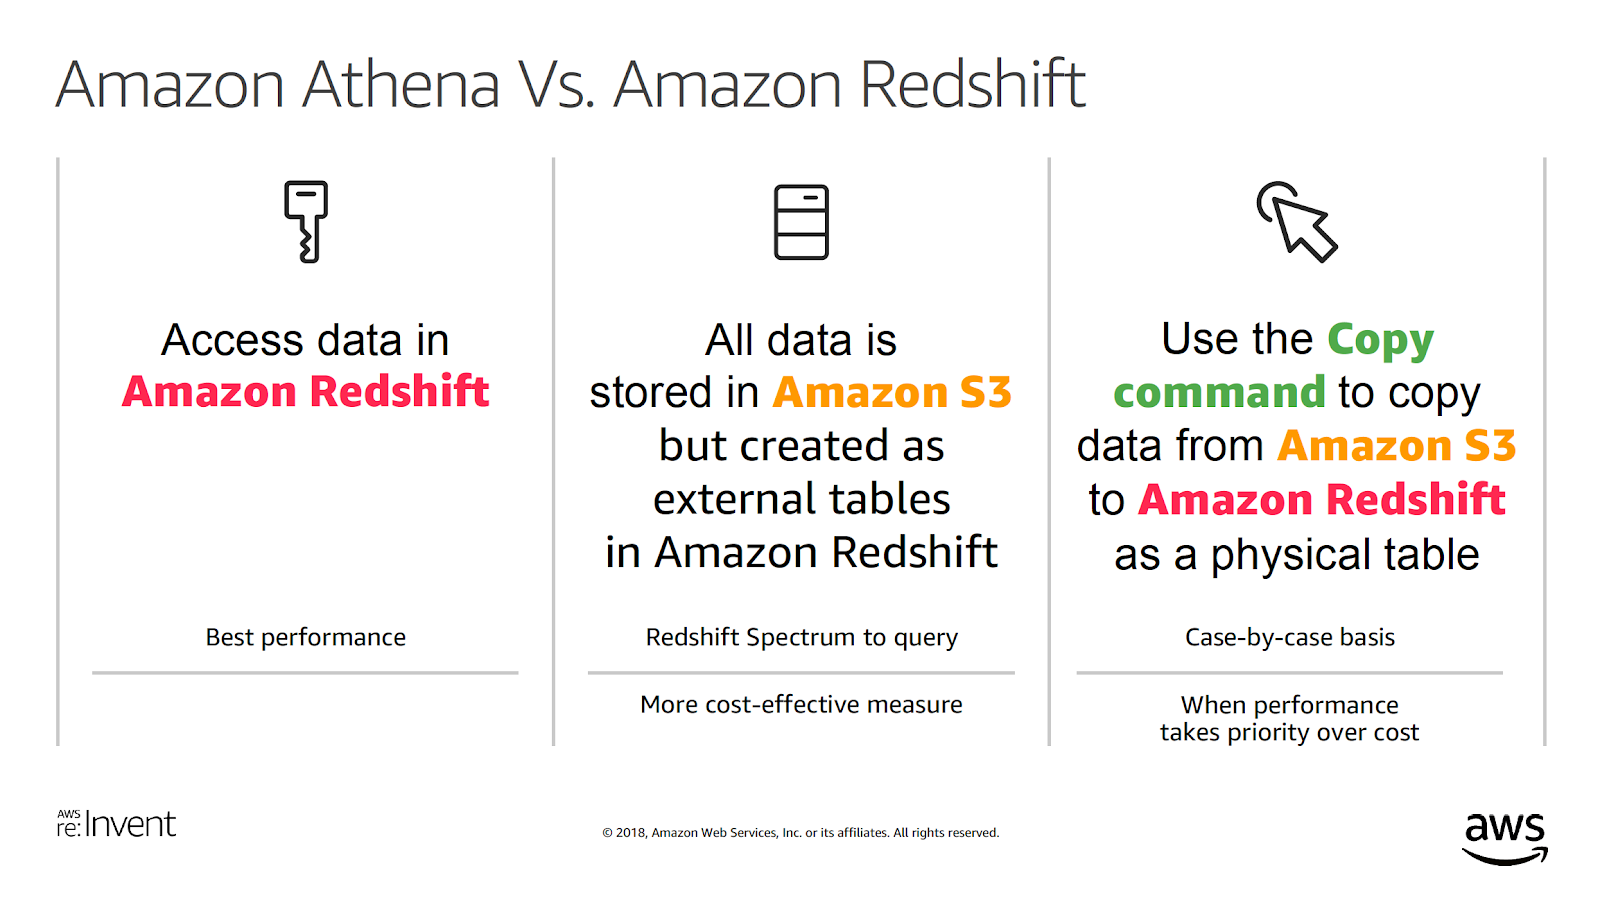
At the start of planning the architecture, the decision came down to choosing between using Amazon Athena and Amazon Redshift for the analytics layer. They chose Amazon Redshift, for three reasons.
-
Permissions. A key issue Dow Jones had to address was restricting access to sensitive customer information and PII. Redshift allows users to set permissions on the data by schema, table, and even fields, e.g. by using IAM roles.
-
Cost / Performance. With cleaned and normalized data already in S3, Amazon Redshift provides options that allow to make a choice between cost and performance. To optimize for cost, keep data in S3, expose it as an external table and use Redshift Spectrum to query the external table. To optimize for performance, create a physical table in Redshift and use the COPY command to move data into the cluster.
-
Analytics tools. To create a BI layer, Redshift allows to point to one place for analysis and access data in S3 and the data marts. Custom dashboards allow for joining different data sets (e.g. customer data, clickstream data, 3rd party data). Users can use any tool of their choice to access the cluster.
 Comparing Amazon Athena vs. Amazon Redshift and Redshift Spectrum
Best practices for querying data
Amazon Redshift is amazing at aggregating large datasets. But with free-range access to a Redshift cluster, e.g. for dashboards or custom reports, you still need to consider that users end up writing poor SQL.
Consider that Redshift is an analytical database (“OLAP”), and unilke transactional databases (“OLTP”) it doesn’t use indexes. And so SQL statements that include a “SELECT *” can impact query and overall cluster performance. Rather, users should select a specific column.
 SQL Query Best Practices on Amazon Redshift
The data team has approached this problem by recommending best practices to their users when querying smaller data sets.
But users don’t always pay attention to these best practices, which is where our automated, individual query recommendations come to the rescue. With individual query optimization recommendations, you can empower your users to tune their SQL queries.
 Query Optimization in Integrate.io
New use cases for data
With the new platform up and running, Dow Jones is enabling the business with new uses cases for data. Three examples of new use cases.

Consumer Publication Dashboard
A custom dashboard that joins clickstream, subscription, membership and demographic data for the Dow Jones consumer publications. With this dashboard, users are able to segment, filter, sort and view who is reading what.
Advertising Performance Dashboard
This dashboard provides analytics and insights into how ads are performing and how users are interacting with those ads. The dashboard joins data sets across eleven different sources doing eleven different things, in one standard format.
Data Visualization with B2B Data
A 360 view of Dow Jones clients in the B2B space, combining clickstream behavioral data with individual customer data.
To power those dashboards, the Redshift cluster hosts over 118TB of data. 100+ users access and query data in Redshift in a self-service model.
With different competing workloads, and 100s of users who write queries, it’s crucial to set up workload management in Redshift.
The Future of Dow Jones’ Data Platform

All the work Dow Jones had put in to create their new data platform was done with the future in mind.
Beyond reporting, Artificial intelligence and predictive analytics are the future of business. Dow Jones, as an industry leader, has to be at the forefront of this change. That is a major reason they’ve prepared this data platform.
When designing the architecture, a key goal was to make their data “AI ready”. Data cleansing and preparation is one of the most challenging and time consuming aspects of data science.
By creating a system that has data cleansing and preparation as a part of the process, they’ve allowed their data scientists to focus on the work that generates results. The work of model building, model training, and model evaluation is where data scientists earn their living, and that is where Dow Jones wants their data scientists to spend their efforts. A key factor here are fast and efficient queries, as that reduces cycle times and increases the volume of iterations for the training models.
AI, machine learning, and predictive analytics is what Dow Jones wants their data platform to do. With Redshift as the aggregatin layer, they’re using Amazon SageMaker to build and train models for predictive analytics.
With the new data platform system in place, Dow Jones is now prepared for the future of data. By using AWS and Redshift, Dow Jones has successfully turned the overflow of data from many different sources from a cost center to a revenue generating one.
Their mass of data from many different sources provides value for their business and customers in the present. For the future, they’re prepared by having a system for organizing and preparing their data for predictive analytics and machine learning.
Why Redshift, why create a data warehouse in the cloud?
As Dow Jones began the first steps to creating this data platform, they chose Amazon Redshift as their technological foundation. Some of the key benefits of using a cloud warehouse like Redshift include:
- Fast performance at a low cost.
- Open and flexible with existing business intelligence tools.
- 1/10th of the cost of traditional data warehouses.
Building your new data platform in the cloud is an obvious choice. The benefits of Amazon Redshift make it an easy pick for teams building new data platforms in the cloud. And geared with our query recommendations, you make sure that your SQL is always tuned to perfection for your data architecture.
If you’re embarking on a similar journey like Dow Jones and have questions about your Redshift deployment or query optimization, chat with us live and we’re happy to help!