Create a Connection
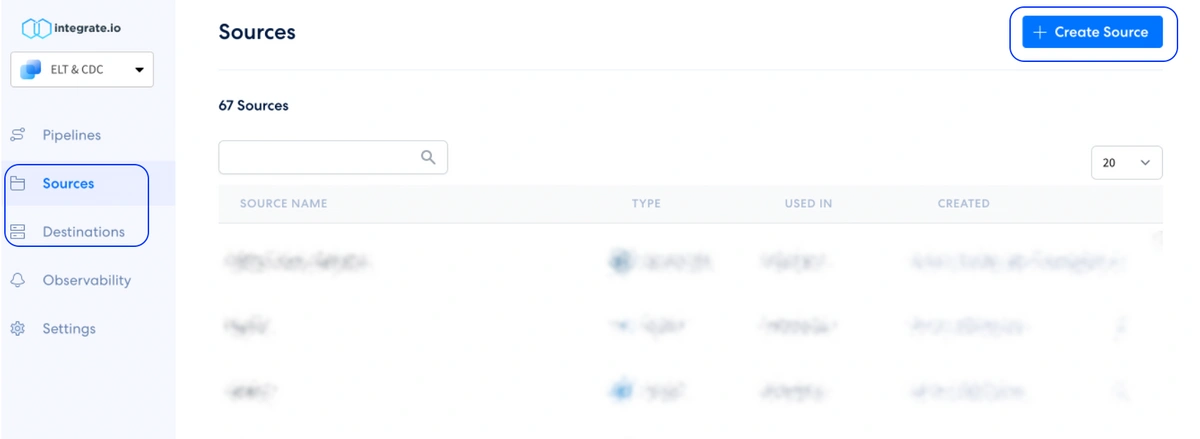
Data observability supports the following data warehouses and databases for monitoring.Data Warehouses
- Redshift
- Snowflake
- BigQuery
Databases
- Postgres
- MySQL
- SQL Server (coming soon)
Create an Alert
1
On your dashboard sidebar, go to Observability. Click + New Alert or Add on Alert +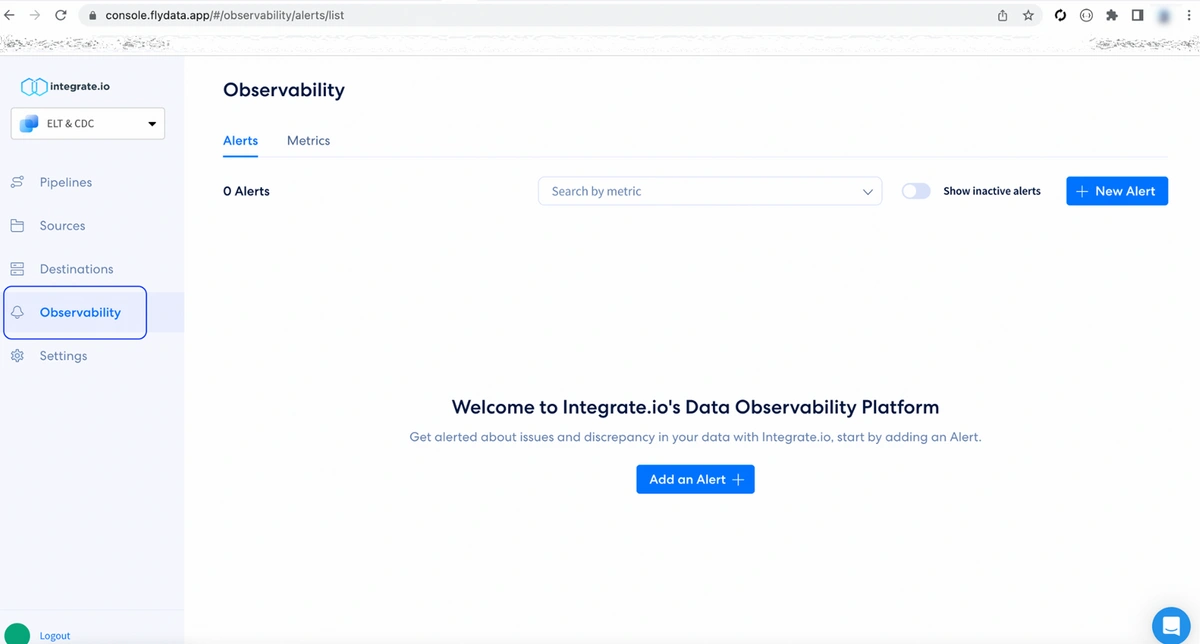
2
On Create new alert page, you can specify the following details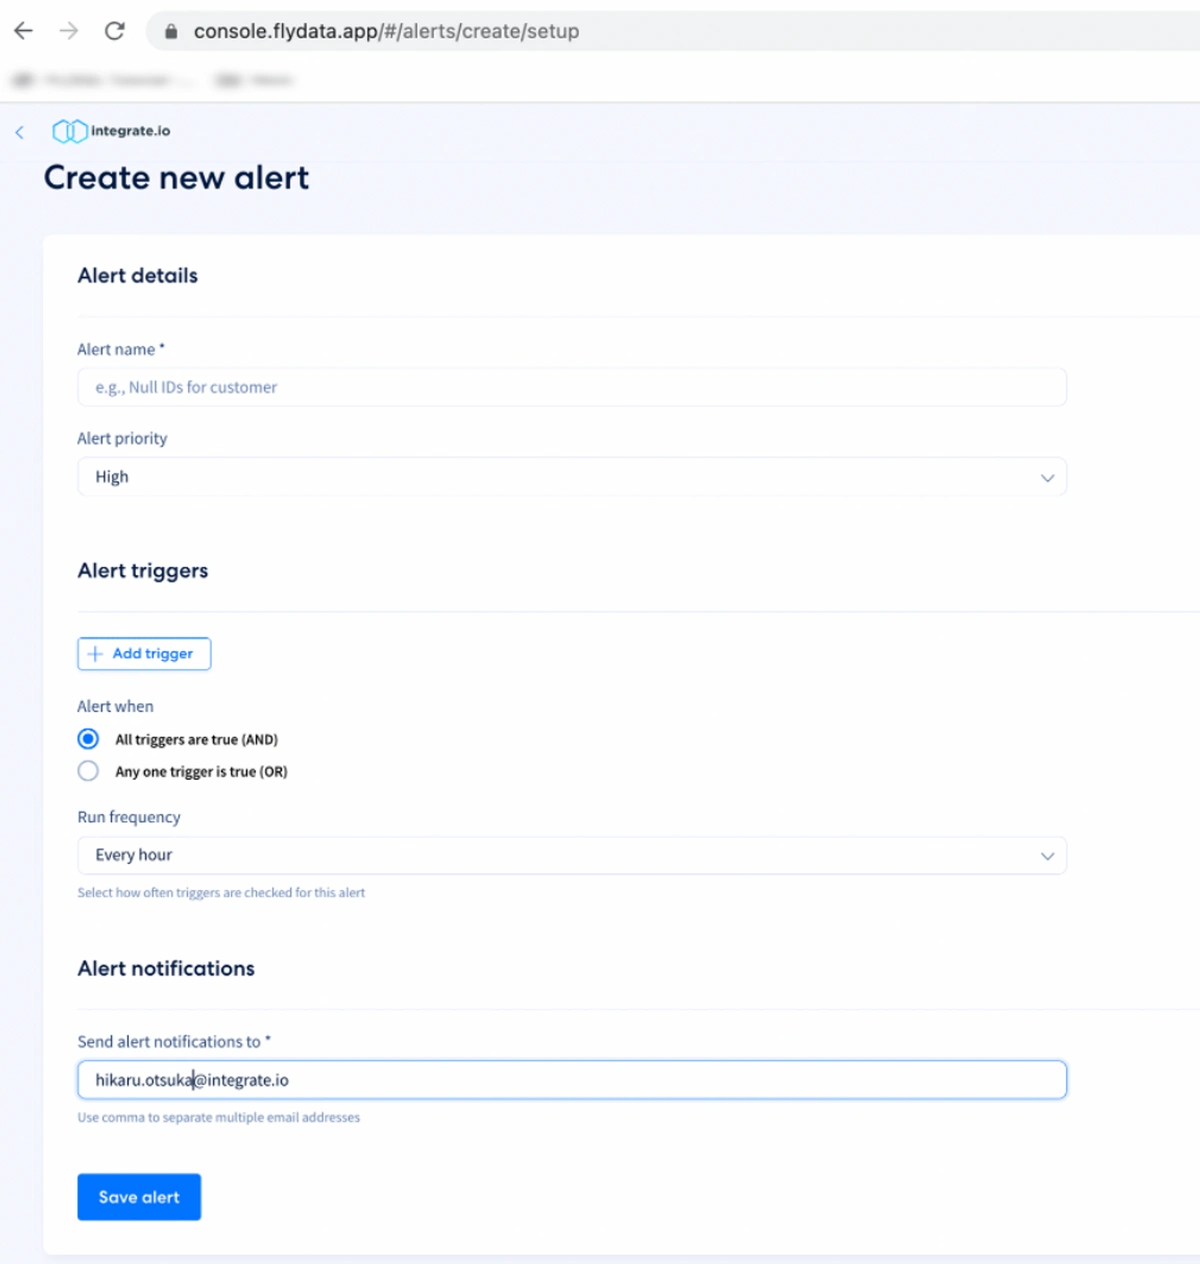
- Alert name : Name of the alert
- Alert priority : Preference on how alert will be categorized
- Run frequency : How often the metric is run and check to be within the threshold
- Alert Notification : List of emails to be notified
3
Add an Alert trigger. You may select an existing metric or create a new metric. Here we are going to create a new metric.Specify which Data store you wish to connect. Then select a Table and Column to be used in the metric. Here, we selected Null as Metric type to detect nulls. See Available Metric Types page to see list of metrics.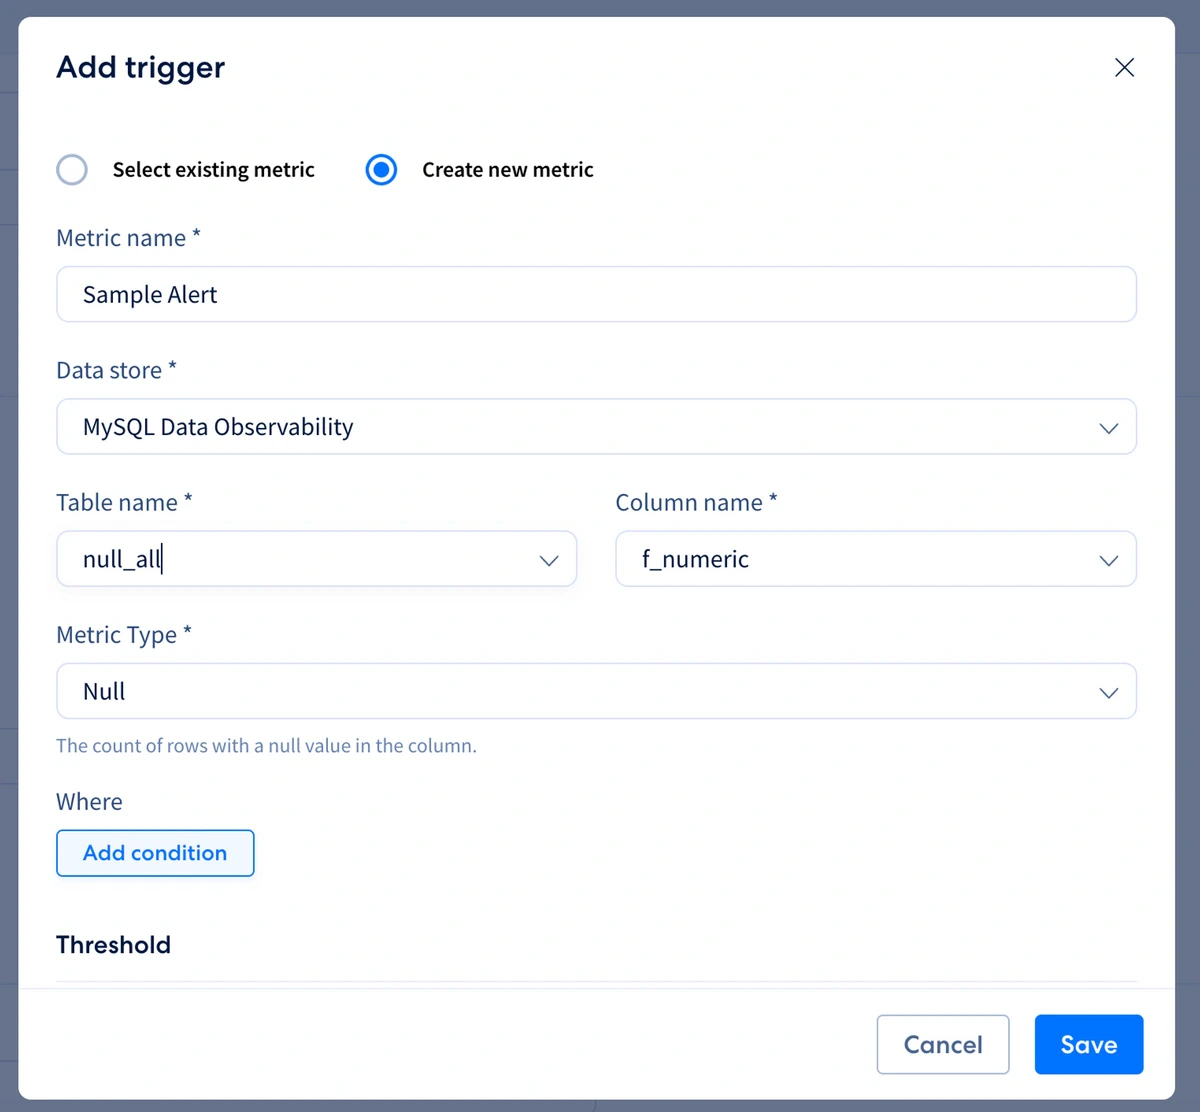
4
You can add conditions specific to columns available in the table. For this example, only rows with column id of 1 will be checked for nulls.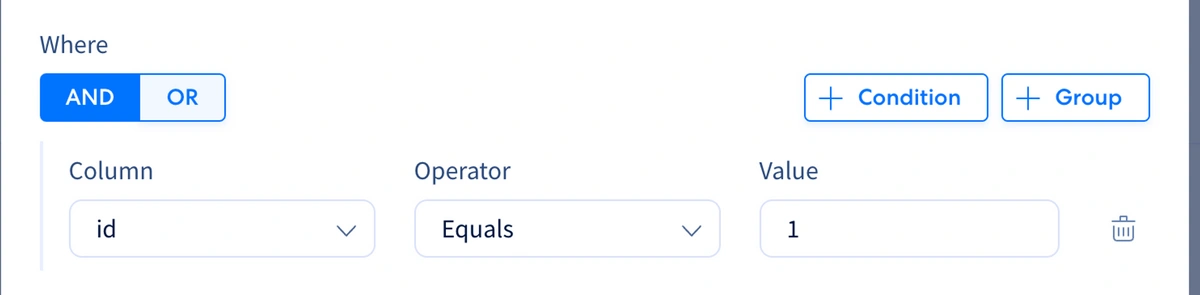
5
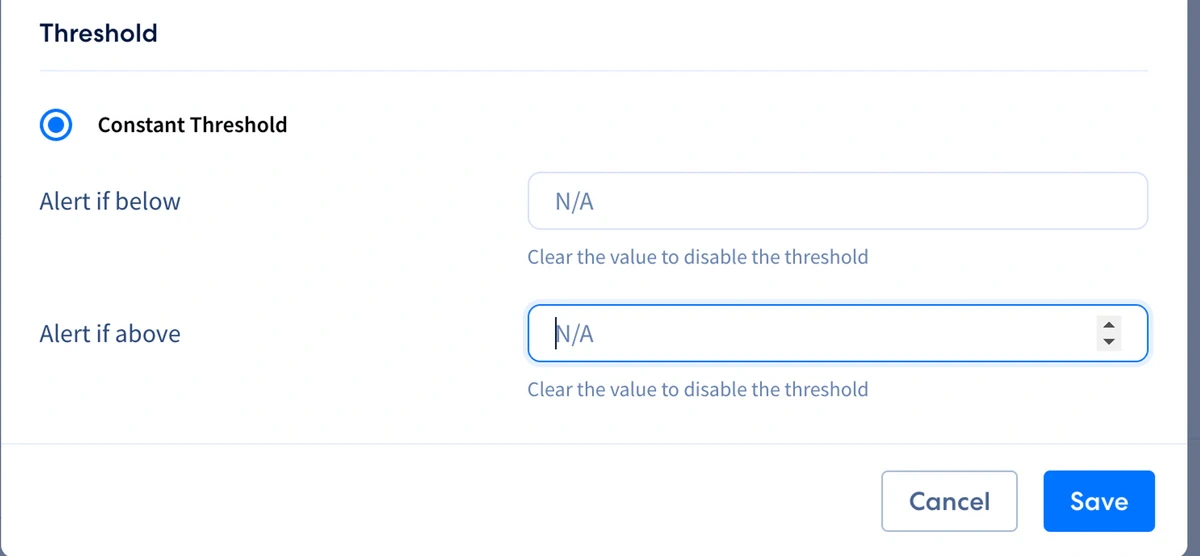
Threshold is the level a metric needs to cross to generate an alert. Specify either of the two thresholds values (Alert if below, Alert if above) or both.