Define and configure Data Observability metrics in Integrate.io. Track data quality measures for your warehouse tables and pipeline outputs.
When you create a metric, you select a data store, table, and metric type. Some metric types also require a column. These selections define the metric’s scope by mapping the data quality check to the table or field it evaluates.Data Observability runs the metric against the selected database or warehouse at its configured frequency. The monitored data can be produced by an Integrate.io pipeline, but Data Observability can also monitor supported data stores independently.
Metrics Settings
You can update Metrics name, Data Store,Table name, Column name, and Metric Type. Adding or deleting an existing condition is also possible.Each metric type has a level, listed in Available Metrics Types:
Table-level metrics run against the selected table. Some, such as Count, evaluate the whole table. Others, such as Nulls, Cardinality, Duplicate, Min, Max, and Freshness, evaluate a selected column in that table.
Pipeline-level metrics, such as Sync Lag and Replication Delay, use pipeline-specific configuration and have separate availability requirements.
The fields shown in the metric form can change according to the selected metric type. For example, a Nulls metric requires a column, while a Count metric evaluates the selected table.You can also add conditions to limit which rows are included in the metric calculation. Conditions can be combined using AND or OR logic and organized into groups.See Available Metrics Types for each metric’s level, supported data types, calculation, and availability.
Changes to a metric’s details apply to every alert configuration that uses the metric as a trigger. Review the affected alerts before saving your changes.
Map a metric to the data it monitors
For example, you can map a Nulls metric to a customer email column or map a Count metric to an orders table. Each selection determines where Integrate.io runs the data quality check:
Data Store identifies the database or warehouse connection.
Table name identifies the table containing the data.
Column name, when required, identifies the field the metric evaluates.
Metric Type defines the calculation to perform.
Conditions optionally restrict the rows included in that calculation.
To change what an existing metric evaluates, edit its Metric Details and select a different available data store, table, column, metric type, or condition. Before saving, review every alert that uses the metric because the changes apply to all of those alert configurations.If an expected table or column is unavailable, confirm that:
The table or column exists in the selected database or warehouse.
The Data Observability connection has permission to access it.
The selected metric type supports the column’s data type.
The correct data store and table have been selected.
Archiving a Metric
Click the vertical-ellipsis (⋮) then click Archive metric
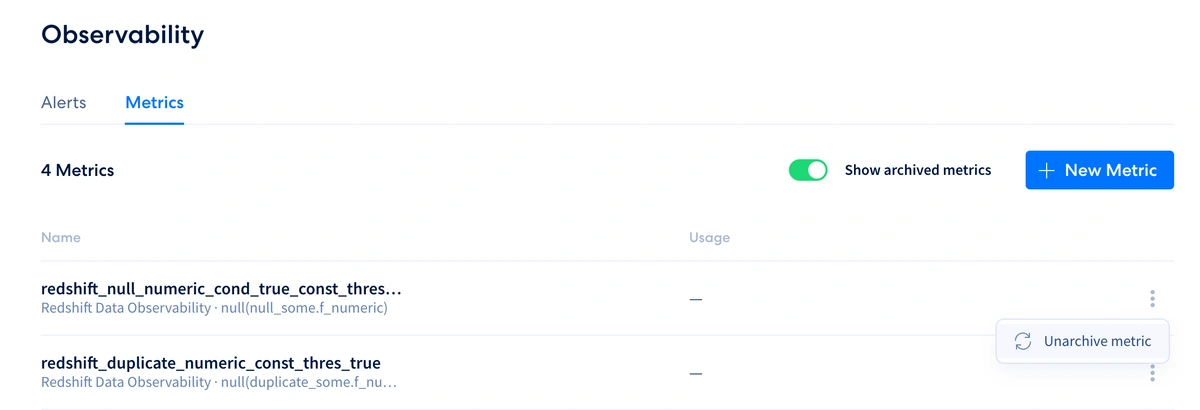
Option to Unarchive a Metric is also available.
Last modified on October 27, 2026
Was this page helpful?
{"docsConfig":{"theme":"aspen","$schema":"https://mintlify.com/docs.json","name":"Integrate.io","colors":{"primary":"#4324F4","light":"#9280F9","dark":"#4324F4"},"logo":{"light":"https://mintcdn.com/integrateio/fpWCvrjvoCDC-WOb/logos/light.svg?fit=max\u0026auto=format\u0026n=fpWCvrjvoCDC-WOb\u0026q=85\u0026s=6a23f8a71e1ffa0f0c27c01ddb7c3f63","dark":"https://mintcdn.com/integrateio/fpWCvrjvoCDC-WOb/logos/dark.svg?fit=max\u0026auto=format\u0026n=fpWCvrjvoCDC-WOb\u0026q=85\u0026s=091eda51ce61a9841be4614e905d68e2","href":"https://www.integrate.io"},"favicon":"https://mintcdn.com/integrateio/MGWLTifrhXADDsEf/favicon.ico?fit=max\u0026auto=format\u0026n=MGWLTifrhXADDsEf\u0026q=85\u0026s=03362dc14c0bc7ff0d53c3f858834ee0","appearance":{"default":"dark"},"background":{"color":{"dark":"#130F21"}},"navbar":{"links":[{"href":"https://www.integrate.io/demo/","label":"Get Started"}],"primary":{"type":"button","label":"Sign In","href":"https://dashboard.integrate.io/auth/login"}},"footer":{"socials":{"x":"https://x.com/integrateio","github":"https://github.com/xplenty","linkedin":"https://www.linkedin.com/company/integrateio","facebook":"https://www.facebook.com/integrate.io"}},"seo":{"metatags":{"og:site_name":"Integrate.io Documentation","twitter:site":"@integrateio"},"indexing":"all"},"fonts":{"heading":{"family":"Manrope","weight":700},"body":{"family":"Inter","weight":400}},"integrations":{"ga4":{"measurementId":"G-PKTLZ0S8Y5"}},"contextual":{"options":["copy","view","chatgpt","claude","perplexity","mcp","cursor","vscode"],"display":"header"},"metadata":{"timestamp":true},"styling":{"latex":true},"navigation":{"global":{"anchors":[{"anchor":"Contact Us","icon":"headset","href":"mailto:support@integrate.io"},{"anchor":"Blog","icon":"newspaper","href":"https://www.integrate.io/blog/"}]},"languages":[{"language":"en","default":true,"href":"etl"},{"language":"ko","href":"ko/etl/category/korean-knowledge-base"},{"language":"jp","href":"jp/etl/category/japanese-knowledge-base"}]}},"deployment":{"deploymentMetadataValue":{"subdomain":"integrateio","hasAudioNarration":false,"actualSubdomain":"integrateio","customDomains":["www.integrate.io"],"gitSource":{"type":"github","owner":"xplenty","repo":"integrate-io-docs","deployBranch":"main","contentDirectory":"","isPrivate":true,"mountPath":"","label":""},"feedback":{"thumbs":true},"entitlements":{"AI_CHAT":{"status":"ENABLED"},"REMOVE_BRANDING":{"status":"DISABLED"},"CONTEXTUAL_FEEDBACK":{"status":"DISABLED"},"CODE_SNIPPET_FEEDBACK":{"status":"DISABLED"},"WEB_MCP":{"status":"ENABLED"},"NARRATION":{"status":"ENABLED"}},"buildId":"6b000c87bab01630722b1163","clientVersion":"0.0.4270","searchFilterCounts":[{"language":"en","tag":"ETL \u0026 Reverse ETL","count":573},{"language":"en","tag":"Knowledge Base","count":569},{"language":"en","tag":"Expressions \u0026 Functions","count":211},{"language":"en","tag":"Functions A to Z","count":195},{"language":"en","tag":"Sources","count":163},{"language":"en","tag":"ELT \u0026 CDC","count":132},{"language":"en","tag":"API Reference","count":115},{"language":"jp","tag":"ETL \u0026 Reverse ETL","count":66},{"language":"jp","tag":"Knowledge Base","count":66},{"language":"ko","tag":"ETL \u0026 Reverse ETL","count":66},{"language":"ko","tag":"Knowledge Base","count":66},{"language":"en","tag":"Destinations","count":47},{"language":"en","tag":"Transformations","count":25},{"language":"en","tag":"Packages \u0026 Workflows","count":24},{"language":"jp","tag":"その他ガイド","count":13},{"language":"ko","tag":"기타 가이드","count":13},{"language":"jp","tag":"入門編ガイド","count":11},{"language":"ko","tag":"초급 가이드","count":11},{"language":"jp","tag":"中級編ガイド","count":10},{"language":"ko","tag":"중급 가이드","count":10},{"language":"jp","tag":"APIガイド","count":9},{"language":"ko","tag":"REST API 가이드","count":9},{"language":"jp","tag":"ストレージガイド","count":7},{"language":"ko","tag":"파일 스토리지 가이드","count":7},{"language":"jp","tag":"Salesforceガイド","count":5},{"language":"ko","tag":"Salesforce 가이드","count":5},{"language":"jp","tag":"データベースガイド","count":4},{"language":"jp","tag":"テンプレートガイド","count":4},{"language":"ko","tag":"데이터베이스 가이드","count":4},{"language":"ko","tag":"템플릿 가이드","count":4}],"searchSettings":{"isFiltersEnabled":false}},"assistantConfig":{"enableAskAiButton":false,"enableStarterQuestions":true,"enableContextualStarterQuestions":true,"enableAskAiSearchBar":true,"deflection":{"enabled":true,"email":"support@integrate.io","showHelpButton":true}},"basePath":"/docs","hasChatPermissions":true,"hasWebMcpPermissions":true,"toggles":[{"name":"kill-isr","enabled":true,"variant":{"name":"disabled","enabled":false,"feature_enabled":true},"impressionData":false},{"name":"custom-rbac-roles","enabled":true,"variant":{"name":"disabled","enabled":false,"feature_enabled":true},"impressionData":false},{"name":"agent-mintlify-slack","enabled":true,"variant":{"name":"disabled","enabled":false,"feature_enabled":true},"impressionData":false},{"name":"agent-integrations-settings","enabled":true,"variant":{"name":"disabled","enabled":false,"feature_enabled":true},"impressionData":false},{"name":"rbac-expansion","enabled":true,"variant":{"name":"disabled","enabled":false,"feature_enabled":true},"impressionData":false},{"name":"automations-pr-grouping","enabled":true,"variant":{"name":"disabled","enabled":false,"feature_enabled":true},"impressionData":false},{"name":"custom-prefix","enabled":true,"variant":{"name":"disabled","enabled":false,"feature_enabled":true},"impressionData":false},{"name":"analytics-v7","enabled":true,"variant":{"name":"disabled","enabled":false,"feature_enabled":true},"impressionData":false},{"name":"user-flows-analytics","enabled":true,"variant":{"name":"disabled","enabled":false,"feature_enabled":true},"impressionData":false},{"name":"no-publish-flow","enabled":true,"variant":{"name":"disabled","enabled":false,"feature_enabled":true},"impressionData":false},{"name":"workos-onboarding","enabled":true,"variant":{"name":"disabled","enabled":false,"feature_enabled":true},"impressionData":false},{"name":"snapshot-serving-live","enabled":true,"variant":{"name":"disabled","enabled":false,"feature_enabled":true},"impressionData":false},{"name":"stripTemperatureMiddleware","enabled":true,"variant":{"name":"disabled","enabled":false,"feature_enabled":true},"impressionData":false},{"name":"support-platform-pylon-zendesk","enabled":true,"variant":{"name":"disabled","enabled":false,"feature_enabled":true},"impressionData":false},{"name":"snapshot-serving","enabled":true,"variant":{"name":"disabled","enabled":false,"feature_enabled":true},"impressionData":false},{"name":"instant-rollback","enabled":true,"variant":{"name":"disabled","enabled":false,"feature_enabled":true},"impressionData":false},{"name":"granular-notifications-server","enabled":true,"variant":{"name":"disabled","enabled":false,"feature_enabled":true},"impressionData":false},{"name":"granular-notifications","enabled":true,"variant":{"name":"disabled","enabled":false,"feature_enabled":true},"impressionData":false},{"name":"automations-fable","enabled":true,"variant":{"name":"disabled","enabled":false,"feature_enabled":true},"impressionData":false},{"name":"fixed-ai-action-pricing","enabled":true,"variant":{"name":"disabled","enabled":false,"feature_enabled":true},"impressionData":false},{"name":"site-roles","enabled":true,"variant":{"name":"disabled","enabled":false,"feature_enabled":true},"impressionData":false},{"name":"automation-resolve-merge-conflict","enabled":true,"variant":{"name":"disabled","enabled":false,"feature_enabled":true},"impressionData":false},{"name":"scoped-publishing","enabled":true,"variant":{"name":"disabled","enabled":false,"feature_enabled":true},"impressionData":false},{"name":"mintql","enabled":true,"variant":{"name":"disabled","enabled":false,"feature_enabled":true},"impressionData":false},{"name":"page-level-analytics","enabled":true,"variant":{"name":"disabled","enabled":false,"feature_enabled":true},"impressionData":false},{"name":"editor-version-history-v2","enabled":true,"variant":{"name":"disabled","enabled":false,"feature_enabled":true},"impressionData":false},{"name":"billing-page-v2","enabled":true,"variant":{"name":"disabled","enabled":false,"feature_enabled":true},"impressionData":false},{"name":"full-page-search","enabled":true,"variant":{"name":"disabled","enabled":false,"feature_enabled":true},"impressionData":false},{"name":"workspace-projects","enabled":true,"variant":{"name":"disabled","enabled":false,"feature_enabled":true},"impressionData":false},{"name":"assistant-v5","enabled":true,"variant":{"name":"disabled","enabled":false,"feature_enabled":true},"impressionData":false},{"name":"fork-pr-previews","enabled":true,"variant":{"name":"disabled","enabled":false,"feature_enabled":true},"impressionData":false},{"name":"revalidation-jwt","enabled":true,"variant":{"name":"disabled","enabled":false,"feature_enabled":true},"impressionData":false},{"name":"workos-sso-scim","enabled":true,"variant":{"name":"disabled","enabled":false,"feature_enabled":true},"impressionData":false},{"name":"hobby-abuse-scan","enabled":true,"variant":{"name":"disabled","enabled":false,"feature_enabled":true},"impressionData":false},{"name":"dashboard-inbox","enabled":true,"variant":{"name":"disabled","enabled":false,"feature_enabled":true},"impressionData":false},{"name":"workos-signup","enabled":true,"variant":{"name":"disabled","enabled":false,"feature_enabled":true},"impressionData":false},{"name":"turbopuffer-dual-write","enabled":true,"variant":{"name":"disabled","enabled":false,"feature_enabled":true},"impressionData":false},{"name":"workos-enabled","enabled":true,"variant":{"name":"disabled","enabled":false,"feature_enabled":true},"impressionData":false},{"name":"approve-review-flow","enabled":true,"variant":{"name":"disabled","enabled":false,"feature_enabled":true},"impressionData":false},{"name":"editor-metadata","enabled":true,"variant":{"name":"disabled","enabled":false,"feature_enabled":true},"impressionData":false},{"name":"sso-setup-deadline-banner","enabled":true,"variant":{"name":"disabled","enabled":false,"feature_enabled":true},"impressionData":false},{"name":"turbopuffer-serve","enabled":true,"variant":{"name":"disabled","enabled":false,"feature_enabled":true},"impressionData":false},{"name":"live-agents","enabled":true,"variant":{"name":"disabled","enabled":false,"feature_enabled":true},"impressionData":false},{"name":"starter-pricing","enabled":true,"variant":{"name":"treatment","enabled":true,"payload":{"type":"string","value":"treatment"},"feature_enabled":true},"impressionData":false},{"name":"llms-txt-v2","enabled":true,"variant":{"name":"disabled","enabled":false,"feature_enabled":true},"impressionData":false},{"name":"wildcard-email-auth","enabled":true,"variant":{"name":"disabled","enabled":false,"feature_enabled":true},"impressionData":false}],"googleFontsInlined":true},"customCss":[]}
{"page":{"pagePath":"cdc/data-observability-metrics","slug":"/cdc/data-observability-metrics","pageMetadata":{"title":"Data observability metrics in ELT \u0026 CDC","description":"Define and configure Data Observability metrics in Integrate.io. Track data quality measures for your warehouse tables and pipeline outputs.","sidebarTitle":"ELT/CDC: Metrics","jp_link":"/jp/etl/category/japanese-knowledge-base","ko_link":"/ko/etl/category/korean-knowledge-base","href":"/cdc/data-observability-metrics"},"description":{"compiledSource":"\"use strict\";\nconst {jsx: _jsx} = arguments[0];\nconst {useMDXComponents: _provideComponents} = arguments[0];\nfunction _createMdxContent(props) {\n const _components = {\n p: \"p\",\n ..._provideComponents(),\n ...props.components\n };\n return _jsx(_components.p, {\n children: \"Define and configure Data Observability metrics in Integrate.io. Track data quality measures for your warehouse tables and pipeline outputs.\"\n });\n}\nfunction MDXContent(props = {}) {\n const {wrapper: MDXLayout} = {\n ..._provideComponents(),\n ...props.components\n };\n return MDXLayout ? _jsx(MDXLayout, {\n ...props,\n children: _jsx(_createMdxContent, {\n ...props\n })\n }) : _createMdxContent(props);\n}\nreturn {\n default: MDXContent\n};\n","frontmatter":{},"scope":{}},"pageType":"default","mdx":{"mdxSource":{"compiledSource":"\"use strict\";const{Fragment:_Fragment,jsx:_jsx,jsxs:_jsxs}=arguments[0];const{useMDXComponents:_provideComponents}=arguments[0];function _createMdxContent(props){const _components={a:`a`,li:`li`,ol:`ol`,p:`p`,strong:`strong`,ul:`ul`,..._provideComponents(),...props.components},{Frame,Heading,OptimizedImage,Warning}=_components;if(!Frame)_missingMdxReference(`Frame`,true);if(!Heading)_missingMdxReference(`Heading`,true);if(!OptimizedImage)_missingMdxReference(`OptimizedImage`,true);if(!Warning)_missingMdxReference(`Warning`,true);return _jsxs(_Fragment,{children:[_jsx(_components.p,{children:`When you create a metric, you select a data store, table, and metric type. Some metric types also require a column. These selections define the metric’s scope by mapping the data quality check to the table or field it evaluates.`}),`\n`,_jsx(_components.p,{children:`Data Observability runs the metric against the selected database or warehouse at its configured frequency. The monitored data can be produced by an Integrate.io pipeline, but Data Observability can also monitor supported data stores independently.`}),`\n`,_jsx(Frame,{children:_jsx(OptimizedImage,{src:`https://mintcdn.com/integrateio/MGWLTifrhXADDsEf/images/cdc/data-observability/image-16.png?fit=max\u0026auto=format\u0026n=MGWLTifrhXADDsEf\u0026q=85\u0026s=fed343e1e414b7ddcce6bb5acce35cbd`,alt:`Metrics list page showing configured metrics`,\"data-og-width\":`760`,width:`760`,\"data-og-height\":`94`,height:`94`,\"data-path\":`images/cdc/data-observability/image-16.png`,\"data-optimize\":`true`,\"data-opv\":`3`,srcset:`https://mintcdn.com/integrateio/MGWLTifrhXADDsEf/images/cdc/data-observability/image-16.png?w=280\u0026fit=max\u0026auto=format\u0026n=MGWLTifrhXADDsEf\u0026q=85\u0026s=eb7e2ef33ba7cf656502ff7b5fdbb67a 280w, https://mintcdn.com/integrateio/MGWLTifrhXADDsEf/images/cdc/data-observability/image-16.png?w=560\u0026fit=max\u0026auto=format\u0026n=MGWLTifrhXADDsEf\u0026q=85\u0026s=8b699330c74489157a059c156f0bd95d 560w, https://mintcdn.com/integrateio/MGWLTifrhXADDsEf/images/cdc/data-observability/image-16.png?w=840\u0026fit=max\u0026auto=format\u0026n=MGWLTifrhXADDsEf\u0026q=85\u0026s=e1fee8cb0d25a4944d24802b0f5b127b 840w, https://mintcdn.com/integrateio/MGWLTifrhXADDsEf/images/cdc/data-observability/image-16.png?w=1100\u0026fit=max\u0026auto=format\u0026n=MGWLTifrhXADDsEf\u0026q=85\u0026s=dc8921e7f462091de8e6dfe4d2096094 1100w, https://mintcdn.com/integrateio/MGWLTifrhXADDsEf/images/cdc/data-observability/image-16.png?w=1650\u0026fit=max\u0026auto=format\u0026n=MGWLTifrhXADDsEf\u0026q=85\u0026s=33a5f41f07b9da62885d47e7b4c84d6b 1650w, https://mintcdn.com/integrateio/MGWLTifrhXADDsEf/images/cdc/data-observability/image-16.png?w=2500\u0026fit=max\u0026auto=format\u0026n=MGWLTifrhXADDsEf\u0026q=85\u0026s=22484e1b7b73306e09a906df44a7db4e 2500w`})}),`\n`,_jsx(`br`,{}),`\n`,_jsx(Frame,{children:_jsx(OptimizedImage,{src:`https://mintcdn.com/integrateio/MGWLTifrhXADDsEf/images/cdc/data-observability/image-17.png?fit=max\u0026auto=format\u0026n=MGWLTifrhXADDsEf\u0026q=85\u0026s=43151a59365b90d5cc6662e03fdf1777`,alt:`Metric detail view with data store, table, and column information`,\"data-og-width\":`1200`,width:`1200`,\"data-og-height\":`494`,height:`494`,\"data-path\":`images/cdc/data-observability/image-17.png`,\"data-optimize\":`true`,\"data-opv\":`3`,srcset:`https://mintcdn.com/integrateio/MGWLTifrhXADDsEf/images/cdc/data-observability/image-17.png?w=280\u0026fit=max\u0026auto=format\u0026n=MGWLTifrhXADDsEf\u0026q=85\u0026s=5d82c28b2ce558b2e6ce2fc5f8d99ba6 280w, https://mintcdn.com/integrateio/MGWLTifrhXADDsEf/images/cdc/data-observability/image-17.png?w=560\u0026fit=max\u0026auto=format\u0026n=MGWLTifrhXADDsEf\u0026q=85\u0026s=603f2d8de3059e55c5c3eeff8c1c3bf4 560w, https://mintcdn.com/integrateio/MGWLTifrhXADDsEf/images/cdc/data-observability/image-17.png?w=840\u0026fit=max\u0026auto=format\u0026n=MGWLTifrhXADDsEf\u0026q=85\u0026s=6972528c5920643ee70d7b3cecf4a478 840w, https://mintcdn.com/integrateio/MGWLTifrhXADDsEf/images/cdc/data-observability/image-17.png?w=1100\u0026fit=max\u0026auto=format\u0026n=MGWLTifrhXADDsEf\u0026q=85\u0026s=a3215267fea4974472b6617409a8a26b 1100w, https://mintcdn.com/integrateio/MGWLTifrhXADDsEf/images/cdc/data-observability/image-17.png?w=1650\u0026fit=max\u0026auto=format\u0026n=MGWLTifrhXADDsEf\u0026q=85\u0026s=9b4233a8f4f2a9762408abfc520cb8b7 1650w, https://mintcdn.com/integrateio/MGWLTifrhXADDsEf/images/cdc/data-observability/image-17.png?w=2500\u0026fit=max\u0026auto=format\u0026n=MGWLTifrhXADDsEf\u0026q=85\u0026s=fa8087bed778d360d28b4dbbca36f956 2500w`})}),`\n`,_jsx(Heading,{level:`2`,id:`metrics-settings`,children:`Metrics Settings`}),`\n`,_jsxs(_components.p,{children:[`You can update `,_jsxs(_components.strong,{children:[`Metrics name, `,_jsx(_components.a,{href:`/cdc/data-stores`,children:`Data Store`}),`,`]}),` `,_jsx(_components.strong,{children:`Table name, Column name,`}),` and `,_jsx(_components.strong,{children:_jsx(_components.a,{href:`/cdc/available-metrics-types`,children:`Metric Type`})}),`. Adding or deleting an existing condition is also possible.`]}),`\n`,_jsxs(_components.p,{children:[`Each metric type has a level, listed in `,_jsx(_components.a,{href:`/cdc/available-metrics-types`,children:`Available Metrics Types`}),`:`]}),`\n`,_jsxs(_components.ul,{children:[`\n`,_jsx(_components.li,{children:`Table-level metrics run against the selected table. Some, such as Count, evaluate the whole table. Others, such as Nulls, Cardinality, Duplicate, Min, Max, and Freshness, evaluate a selected column in that table.`}),`\n`,_jsx(_components.li,{children:`Pipeline-level metrics, such as Sync Lag and Replication Delay, use pipeline-specific configuration and have separate availability requirements.`}),`\n`]}),`\n`,_jsx(_components.p,{children:`The fields shown in the metric form can change according to the selected metric type. For example, a Nulls metric requires a column, while a Count metric evaluates the selected table.`}),`\n`,_jsx(_components.p,{children:`You can also add conditions to limit which rows are included in the metric calculation. Conditions can be combined using AND or OR logic and organized into groups.`}),`\n`,_jsxs(_components.p,{children:[`See `,_jsx(_components.a,{href:`/cdc/available-metrics-types`,children:`Available Metrics Types`}),` for each metric’s level, supported data types, calculation, and availability.`]}),`\n`,_jsx(Frame,{children:_jsx(OptimizedImage,{src:`https://mintcdn.com/integrateio/MGWLTifrhXADDsEf/images/cdc/data-observability/image-18.png?fit=max\u0026auto=format\u0026n=MGWLTifrhXADDsEf\u0026q=85\u0026s=e9e5ca60a22c4abf5b1e29fdebe44e5a`,alt:`Metrics settings form with name, data store, and table fields`,\"data-og-width\":`1200`,width:`1200`,\"data-og-height\":`1321`,height:`1321`,\"data-path\":`images/cdc/data-observability/image-18.png`,\"data-optimize\":`true`,\"data-opv\":`3`,srcset:`https://mintcdn.com/integrateio/MGWLTifrhXADDsEf/images/cdc/data-observability/image-18.png?w=280\u0026fit=max\u0026auto=format\u0026n=MGWLTifrhXADDsEf\u0026q=85\u0026s=0694c6227663d20853abfd9ed82dca34 280w, https://mintcdn.com/integrateio/MGWLTifrhXADDsEf/images/cdc/data-observability/image-18.png?w=560\u0026fit=max\u0026auto=format\u0026n=MGWLTifrhXADDsEf\u0026q=85\u0026s=377bc83d7cb6a403e24d586b367ffb47 560w, https://mintcdn.com/integrateio/MGWLTifrhXADDsEf/images/cdc/data-observability/image-18.png?w=840\u0026fit=max\u0026auto=format\u0026n=MGWLTifrhXADDsEf\u0026q=85\u0026s=f49dda7f7025b027b78bee014392fe7a 840w, https://mintcdn.com/integrateio/MGWLTifrhXADDsEf/images/cdc/data-observability/image-18.png?w=1100\u0026fit=max\u0026auto=format\u0026n=MGWLTifrhXADDsEf\u0026q=85\u0026s=11db1b1adcf0ad195c77892ba2a99185 1100w, https://mintcdn.com/integrateio/MGWLTifrhXADDsEf/images/cdc/data-observability/image-18.png?w=1650\u0026fit=max\u0026auto=format\u0026n=MGWLTifrhXADDsEf\u0026q=85\u0026s=9e0e175fe7fa2433babece4b29e4707c 1650w, https://mintcdn.com/integrateio/MGWLTifrhXADDsEf/images/cdc/data-observability/image-18.png?w=2500\u0026fit=max\u0026auto=format\u0026n=MGWLTifrhXADDsEf\u0026q=85\u0026s=82ae37a76417e1475d921a8d7d93d107 2500w`})}),`\n`,_jsx(`br`,{}),`\n`,_jsx(Frame,{children:_jsx(OptimizedImage,{src:`https://mintcdn.com/integrateio/MGWLTifrhXADDsEf/images/cdc/data-observability/image-19.png?fit=max\u0026auto=format\u0026n=MGWLTifrhXADDsEf\u0026q=85\u0026s=0131613766892df85db6c21036b7f53b`,alt:`Metrics settings with column, metric type, and conditions`,\"data-og-width\":`1200`,width:`1200`,\"data-og-height\":`138`,height:`138`,\"data-path\":`images/cdc/data-observability/image-19.png`,\"data-optimize\":`true`,\"data-opv\":`3`,srcset:`https://mintcdn.com/integrateio/MGWLTifrhXADDsEf/images/cdc/data-observability/image-19.png?w=280\u0026fit=max\u0026auto=format\u0026n=MGWLTifrhXADDsEf\u0026q=85\u0026s=b03fc48d7051b48b46765b4d8cccb597 280w, https://mintcdn.com/integrateio/MGWLTifrhXADDsEf/images/cdc/data-observability/image-19.png?w=560\u0026fit=max\u0026auto=format\u0026n=MGWLTifrhXADDsEf\u0026q=85\u0026s=34c490856ab61c7822798fcb304ac8ba 560w, https://mintcdn.com/integrateio/MGWLTifrhXADDsEf/images/cdc/data-observability/image-19.png?w=840\u0026fit=max\u0026auto=format\u0026n=MGWLTifrhXADDsEf\u0026q=85\u0026s=fc72acb22aebc31f6088e92314a28054 840w, https://mintcdn.com/integrateio/MGWLTifrhXADDsEf/images/cdc/data-observability/image-19.png?w=1100\u0026fit=max\u0026auto=format\u0026n=MGWLTifrhXADDsEf\u0026q=85\u0026s=f2e14981a5e9bdcf3c4fe8141601e85d 1100w, https://mintcdn.com/integrateio/MGWLTifrhXADDsEf/images/cdc/data-observability/image-19.png?w=1650\u0026fit=max\u0026auto=format\u0026n=MGWLTifrhXADDsEf\u0026q=85\u0026s=7e78f49eda7668006f9c7cf66b961f99 1650w, https://mintcdn.com/integrateio/MGWLTifrhXADDsEf/images/cdc/data-observability/image-19.png?w=2500\u0026fit=max\u0026auto=format\u0026n=MGWLTifrhXADDsEf\u0026q=85\u0026s=d2f525e066b4c82f1bd00de36459a7c9 2500w`})}),`\n`,_jsx(Warning,{children:_jsx(_components.p,{children:`Changes to a metric’s details apply to every alert configuration that uses the metric as a trigger. Review the affected alerts before saving your changes.`})}),`\n`,_jsx(Heading,{level:`2`,id:`map-a-metric-to-the-data-it-monitors`,children:`Map a metric to the data it monitors`}),`\n`,_jsx(_components.p,{children:`For example, you can map a Nulls metric to a customer email column or map a Count metric to an orders table. Each selection determines where Integrate.io runs the data quality check:`}),`\n`,_jsxs(_components.ol,{children:[`\n`,_jsx(_components.li,{children:`Data Store identifies the database or warehouse connection.`}),`\n`,_jsx(_components.li,{children:`Table name identifies the table containing the data.`}),`\n`,_jsx(_components.li,{children:`Column name, when required, identifies the field the metric evaluates.`}),`\n`,_jsx(_components.li,{children:`Metric Type defines the calculation to perform.`}),`\n`,_jsx(_components.li,{children:`Conditions optionally restrict the rows included in that calculation.`}),`\n`]}),`\n`,_jsx(_components.p,{children:`To change what an existing metric evaluates, edit its Metric Details and select a different available data store, table, column, metric type, or condition. Before saving, review every alert that uses the metric because the changes apply to all of those alert configurations.`}),`\n`,_jsx(_components.p,{children:`If an expected table or column is unavailable, confirm that:`}),`\n`,_jsxs(_components.ul,{children:[`\n`,_jsx(_components.li,{children:`The table or column exists in the selected database or warehouse.`}),`\n`,_jsx(_components.li,{children:`The Data Observability connection has permission to access it.`}),`\n`,_jsx(_components.li,{children:`The selected metric type supports the column’s data type.`}),`\n`,_jsx(_components.li,{children:`The correct data store and table have been selected.`}),`\n`]}),`\n`,_jsx(Heading,{level:`2`,id:`archiving-a-metric`,children:`Archiving a Metric`}),`\n`,_jsx(_components.p,{children:`Click the vertical-ellipsis (⋮) then click Archive metric`}),`\n`,_jsx(Frame,{children:_jsx(OptimizedImage,{src:`https://mintcdn.com/integrateio/MGWLTifrhXADDsEf/images/cdc/data-observability/image-20.png?fit=max\u0026auto=format\u0026n=MGWLTifrhXADDsEf\u0026q=85\u0026s=0138d55494de15938ff767fa6fc137fa`,alt:`Context menu with Archive metric option`,\"data-og-width\":`1200`,width:`1200`,\"data-og-height\":`117`,height:`117`,\"data-path\":`images/cdc/data-observability/image-20.png`,\"data-optimize\":`true`,\"data-opv\":`3`,srcset:`https://mintcdn.com/integrateio/MGWLTifrhXADDsEf/images/cdc/data-observability/image-20.png?w=280\u0026fit=max\u0026auto=format\u0026n=MGWLTifrhXADDsEf\u0026q=85\u0026s=f9eeaf50567bed715a9a235f4aae470a 280w, https://mintcdn.com/integrateio/MGWLTifrhXADDsEf/images/cdc/data-observability/image-20.png?w=560\u0026fit=max\u0026auto=format\u0026n=MGWLTifrhXADDsEf\u0026q=85\u0026s=15c4f0bcdafb289afe8d728c6aae286f 560w, https://mintcdn.com/integrateio/MGWLTifrhXADDsEf/images/cdc/data-observability/image-20.png?w=840\u0026fit=max\u0026auto=format\u0026n=MGWLTifrhXADDsEf\u0026q=85\u0026s=2ee29328d59a2701b400b0dcf9ff4352 840w, https://mintcdn.com/integrateio/MGWLTifrhXADDsEf/images/cdc/data-observability/image-20.png?w=1100\u0026fit=max\u0026auto=format\u0026n=MGWLTifrhXADDsEf\u0026q=85\u0026s=0526c5c0cf50f42858414d505a081de3 1100w, https://mintcdn.com/integrateio/MGWLTifrhXADDsEf/images/cdc/data-observability/image-20.png?w=1650\u0026fit=max\u0026auto=format\u0026n=MGWLTifrhXADDsEf\u0026q=85\u0026s=ff7b8b80639844c87c6c825ca0c89b8f 1650w, https://mintcdn.com/integrateio/MGWLTifrhXADDsEf/images/cdc/data-observability/image-20.png?w=2500\u0026fit=max\u0026auto=format\u0026n=MGWLTifrhXADDsEf\u0026q=85\u0026s=6ad5213ee06e1b02df7751e58114ccb9 2500w`})}),`\n`,_jsxs(_components.p,{children:[`Option to `,_jsx(_components.strong,{children:`Unarchive a Metric`}),` is also available.`]}),`\n`,_jsx(Frame,{children:_jsx(OptimizedImage,{src:`https://mintcdn.com/integrateio/MGWLTifrhXADDsEf/images/cdc/data-observability/image-21.png?fit=max\u0026auto=format\u0026n=MGWLTifrhXADDsEf\u0026q=85\u0026s=62c4e0495277e259e0cd167455925a48`,alt:`Context menu with Unarchive metric option`,\"data-og-width\":`1200`,width:`1200`,\"data-og-height\":`410`,height:`410`,\"data-path\":`images/cdc/data-observability/image-21.png`,\"data-optimize\":`true`,\"data-opv\":`3`,srcset:`https://mintcdn.com/integrateio/MGWLTifrhXADDsEf/images/cdc/data-observability/image-21.png?w=280\u0026fit=max\u0026auto=format\u0026n=MGWLTifrhXADDsEf\u0026q=85\u0026s=a9440a87b415e643327ddd8e2eefd77b 280w, https://mintcdn.com/integrateio/MGWLTifrhXADDsEf/images/cdc/data-observability/image-21.png?w=560\u0026fit=max\u0026auto=format\u0026n=MGWLTifrhXADDsEf\u0026q=85\u0026s=569c163475f021698ac56823f03d5c24 560w, https://mintcdn.com/integrateio/MGWLTifrhXADDsEf/images/cdc/data-observability/image-21.png?w=840\u0026fit=max\u0026auto=format\u0026n=MGWLTifrhXADDsEf\u0026q=85\u0026s=be3ce33a3a385001bd967824957a2939 840w, https://mintcdn.com/integrateio/MGWLTifrhXADDsEf/images/cdc/data-observability/image-21.png?w=1100\u0026fit=max\u0026auto=format\u0026n=MGWLTifrhXADDsEf\u0026q=85\u0026s=6be0ebd5a40baa50dfcf9699673d5896 1100w, https://mintcdn.com/integrateio/MGWLTifrhXADDsEf/images/cdc/data-observability/image-21.png?w=1650\u0026fit=max\u0026auto=format\u0026n=MGWLTifrhXADDsEf\u0026q=85\u0026s=dbe14aa340723ed179bf1827606f84f2 1650w, https://mintcdn.com/integrateio/MGWLTifrhXADDsEf/images/cdc/data-observability/image-21.png?w=2500\u0026fit=max\u0026auto=format\u0026n=MGWLTifrhXADDsEf\u0026q=85\u0026s=b91986319b0de0d3001c2e922221308c 2500w`})})]})}function MDXContent(props={}){const{wrapper:MDXLayout}={..._provideComponents(),...props.components};return MDXLayout?_jsx(MDXLayout,{...props,children:_jsx(_createMdxContent,{...props})}):_createMdxContent(props)}return{default:MDXContent};function _missingMdxReference(id,component){throw new Error(`Expected `+(component?`component`:`object`)+\" `\"+id+\"` to be defined: you likely forgot to import, pass, or provide it.\")}","frontmatter":{},"scope":{"config":{},"pageMetadata":{"title":"Data observability metrics in ELT \u0026 CDC","description":"Define and configure Data Observability metrics in Integrate.io. Track data quality measures for your warehouse tables and pipeline outputs.","sidebarTitle":"ELT/CDC: Metrics","jp_link":"/jp/etl/category/japanese-knowledge-base","ko_link":"/ko/etl/category/korean-knowledge-base","href":"/cdc/data-observability-metrics"}}},"mdxSourceWithNoJs":null},"mdxExtracts":{"tableOfContents":[{"title":"Metrics Settings","slug":"metrics-settings","depth":2,"children":[]},{"title":"Map a metric to the data it monitors","slug":"map-a-metric-to-the-data-it-monitors","depth":2,"children":[]},{"title":"Archiving a Metric","slug":"archiving-a-metric","depth":2,"children":[]}],"codeExamples":{}},"jsLinks":["/docs/_mintlify/custom/integrateio/ee07775a8a76a2d8/structured-data.js"],"subdomain":"integrateio","siteName":"Integrate.io","title":"Data observability metrics in ELT \u0026 CDC - Integrate.io","contextualStarterQuestions":[{"_id":"6ae132e14f325accce198bb9","deploymentId":"6993e05a49fd188f36451435","questionText":"How do I create a metric?","status":"active","generatedBy":"contextual","path":"cdc/data-observability-metrics","createdAt":"2026-10-27T23:25:21.606Z","updatedAt":"2026-10-27T23:25:21.606Z","__v":0},{"_id":"6ae132e14f325accce198bba","deploymentId":"6993e05a49fd188f36451435","questionText":"What metric types are available?","status":"active","generatedBy":"contextual","path":"cdc/data-observability-metrics","createdAt":"2026-10-27T23:25:21.606Z","updatedAt":"2026-10-27T23:25:21.606Z","__v":0},{"_id":"6ae132e14f325accce198bbb","deploymentId":"6993e05a49fd188f36451435","questionText":"How often do metrics run?","status":"active","generatedBy":"contextual","path":"cdc/data-observability-metrics","createdAt":"2026-10-27T23:25:21.606Z","updatedAt":"2026-10-27T23:25:21.606Z","__v":0}],"navMaps":{"firstHrefInVersion":{},"firstHrefInLanguage":{"en":{"href":"/cdc/data-observability-metrics","matchLevel":0},"ko":{"href":"/ko/etl/category/korean-knowledge-base","matchLevel":4},"jp":{"href":"/jp/etl/category/japanese-knowledge-base","matchLevel":4}}},"lastModified":"2026-10-27T23:25:11.889Z","gitLastModified":"2026-10-27T23:24:44.000Z","originalFileLocation":"cdc/data-observability-metrics.mdx","locale":"en"},"headHtml":"\u003cscript data-mint-head>(function(){var d=document.documentElement,p=null;if(!p){try{p=localStorage.getItem(\"isDarkMode\")}catch(e){}if(p==='true')p='dark';else if(p==='false')p='light';if(p!=='light'\u0026\u0026p!=='dark'\u0026\u0026p!=='system')p=\"dark\"}var r=p==='system'?(matchMedia(\"(prefers-color-scheme: dark)\").matches?'dark':'light'):p;d.classList.remove(r==='dark'?'light':'dark');d.classList.add(r);d.setAttribute(\"data-theme-preference\",p)})();\u003c/script>\u003cmeta data-mint-head name=\"description\" content=\"Define and configure Data Observability metrics in Integrate.io. Track data quality measures for your warehouse tables and pipeline outputs.\">\u003cmeta data-mint-head name=\"application-name\" content=\"Integrate.io\">\u003cmeta data-mint-head name=\"generator\" content=\"Mintlify\">\u003clink data-mint-head rel=\"icon\" type=\"image/png\" sizes=\"192x192\" href=\"/docs/mintlify-assets/_mintlify/favicons/integrateio/aKp_gZA-xHF0z4no/_generated/favicon/android-chrome-192x192.png\" media=\"(prefers-color-scheme: light)\">\u003clink data-mint-head rel=\"apple-touch-icon\" type=\"image/png\" sizes=\"180x180\" href=\"/docs/mintlify-assets/_mintlify/favicons/integrateio/aKp_gZA-xHF0z4no/_generated/favicon/apple-touch-icon.png\">\u003clink data-mint-head rel=\"icon\" type=\"image/png\" sizes=\"16x16\" href=\"/docs/mintlify-assets/_mintlify/favicons/integrateio/aKp_gZA-xHF0z4no/_generated/favicon/favicon-16x16.png\" media=\"(prefers-color-scheme: light)\">\u003clink data-mint-head rel=\"icon\" type=\"image/png\" sizes=\"32x32\" href=\"/docs/mintlify-assets/_mintlify/favicons/integrateio/aKp_gZA-xHF0z4no/_generated/favicon/favicon-32x32.png\" media=\"(prefers-color-scheme: light)\">\u003clink data-mint-head rel=\"shortcut icon\" type=\"image/x-icon\" href=\"/docs/mintlify-assets/_mintlify/favicons/integrateio/aKp_gZA-xHF0z4no/_generated/favicon/favicon.ico\" media=\"(prefers-color-scheme: light)\">\u003clink data-mint-head rel=\"icon\" type=\"image/png\" sizes=\"192x192\" href=\"/docs/mintlify-assets/_mintlify/favicons/integrateio/aKp_gZA-xHF0z4no/_generated/favicon-dark/android-chrome-192x192.png\" media=\"(prefers-color-scheme: dark)\">\u003clink data-mint-head rel=\"icon\" type=\"image/png\" sizes=\"16x16\" href=\"/docs/mintlify-assets/_mintlify/favicons/integrateio/aKp_gZA-xHF0z4no/_generated/favicon-dark/favicon-16x16.png\" media=\"(prefers-color-scheme: dark)\">\u003clink data-mint-head rel=\"icon\" type=\"image/png\" sizes=\"32x32\" href=\"/docs/mintlify-assets/_mintlify/favicons/integrateio/aKp_gZA-xHF0z4no/_generated/favicon-dark/favicon-32x32.png\" media=\"(prefers-color-scheme: dark)\">\u003clink data-mint-head rel=\"shortcut icon\" type=\"image/x-icon\" href=\"/docs/mintlify-assets/_mintlify/favicons/integrateio/aKp_gZA-xHF0z4no/_generated/favicon-dark/favicon.ico\" media=\"(prefers-color-scheme: dark)\">\u003cmeta data-mint-head property=\"og:title\" content=\"Data observability metrics in ELT \u0026amp; CDC - Integrate.io\">\u003cmeta data-mint-head property=\"og:description\" content=\"Define and configure Data Observability metrics in Integrate.io. Track data quality measures for your warehouse tables and pipeline outputs.\">\u003cmeta data-mint-head property=\"og:site_name\" content=\"Integrate.io Documentation\">\u003cmeta data-mint-head property=\"og:url\" content=\"https://www.integrate.io/docs/cdc/data-observability-metrics\">\u003cmeta data-mint-head property=\"og:type\" content=\"website\">\u003cmeta data-mint-head property=\"og:image\" content=\"https://integrateio.mintlify.site/docs/_mintlify/api/og/v2?division=Data+Observability\u0026amp;title=Data+observability+metrics+in+ELT+%26+CDC\u0026amp;description=Define+and+configure+Data+Observability+metrics+in+Integrate.io.+Track+data+quality+measures+for+your+warehouse+tables+and+pipeline+outputs.\u0026amp;theme=c665eb0793984e38cca55537\u0026amp;signature=1bdaa0111564e458e3ec518328d2d158f80dc491c3ed0d73d72493dabfa4ffc1\">\u003cmeta data-mint-head property=\"og:image:width\" content=\"1200\">\u003cmeta data-mint-head property=\"og:image:height\" content=\"630\">\u003cmeta data-mint-head name=\"twitter:card\" content=\"summary_large_image\">\u003cmeta data-mint-head name=\"twitter:title\" content=\"Data observability metrics in ELT \u0026amp; CDC - Integrate.io\">\u003cmeta data-mint-head name=\"twitter:description\" content=\"Define and configure Data Observability metrics in Integrate.io. Track data quality measures for your warehouse tables and pipeline outputs.\">\u003cmeta data-mint-head name=\"twitter:image\" content=\"https://integrateio.mintlify.site/docs/_mintlify/api/og/v2?division=Data+Observability\u0026amp;title=Data+observability+metrics+in+ELT+%26+CDC\u0026amp;description=Define+and+configure+Data+Observability+metrics+in+Integrate.io.+Track+data+quality+measures+for+your+warehouse+tables+and+pipeline+outputs.\u0026amp;theme=c665eb0793984e38cca55537\u0026amp;signature=1bdaa0111564e458e3ec518328d2d158f80dc491c3ed0d73d72493dabfa4ffc1\">\u003cmeta data-mint-head name=\"twitter:image:width\" content=\"1200\">\u003cmeta data-mint-head name=\"twitter:image:height\" content=\"630\">\u003cmeta data-mint-head name=\"msapplication-config\" content=\"/docs/mintlify-assets/_mintlify/favicons/integrateio/aKp_gZA-xHF0z4no/_generated/favicon/browserconfig.xml\">\u003cmeta data-mint-head name=\"apple-mobile-web-app-title\" content=\"Integrate.io\">\u003cmeta data-mint-head name=\"msapplication-TileColor\" content=\"#4324F4\">\u003clink data-mint-head rel=\"canonical\" href=\"https://www.integrate.io/docs/cdc/data-observability-metrics\">\u003clink data-mint-head rel=\"alternate\" type=\"application/xml\" href=\"/docs/sitemap.xml\">\u003clink data-mint-head rel=\"alternate\" type=\"text/markdown\" href=\"/docs/cdc/data-observability-metrics.md\">\u003clink data-mint-head rel=\"alternate\" hreflang=\"en\" href=\"https://www.integrate.io/docs/cdc/data-observability-metrics\">\u003clink data-mint-head rel=\"alternate\" hreflang=\"ko\" href=\"https://www.integrate.io/docs/ko/etl/category/korean-knowledge-base\">\u003clink data-mint-head rel=\"alternate\" hreflang=\"ja\" href=\"https://www.integrate.io/docs/jp/etl/category/japanese-knowledge-base\">\u003clink data-mint-head rel=\"alternate\" hreflang=\"x-default\" href=\"https://www.integrate.io/docs/cdc/data-observability-metrics\">\u003cscript data-mint-head type=\"application/ld+json\">{\"@context\":\"https://schema.org\",\"@graph\":[{\"@type\":\"Organization\",\"@id\":\"https://www.integrate.io/#organization\",\"name\":\"Integrate.io\",\"url\":\"https://www.integrate.io\",\"logo\":{\"@type\":\"ImageObject\",\"url\":\"https://mintcdn.com/integrateio/fpWCvrjvoCDC-WOb/logos/light.svg?fit=max\u0026auto=format\u0026n=fpWCvrjvoCDC-WOb\u0026q=85\u0026s=6a23f8a71e1ffa0f0c27c01ddb7c3f63\"}},{\"@type\":\"WebSite\",\"@id\":\"https://www.integrate.io/docs#website\",\"name\":\"Integrate.io\",\"url\":\"https://www.integrate.io/docs\",\"publisher\":{\"@id\":\"https://www.integrate.io/#organization\"}},{\"@type\":\"WebPage\",\"@id\":\"https://www.integrate.io/docs/cdc/data-observability-metrics#webpage\",\"url\":\"https://www.integrate.io/docs/cdc/data-observability-metrics\",\"name\":\"Data observability metrics in ELT \u0026 CDC\",\"description\":\"Define and configure Data Observability metrics in Integrate.io. Track data quality measures for your warehouse tables and pipeline outputs.\",\"dateModified\":\"2026-10-27T23:24:44.000Z\",\"isPartOf\":{\"@id\":\"https://www.integrate.io/docs#website\"},\"breadcrumb\":{\"@id\":\"https://www.integrate.io/docs/cdc/data-observability-metrics#breadcrumb\"}},{\"@type\":\"BreadcrumbList\",\"@id\":\"https://www.integrate.io/docs/cdc/data-observability-metrics#breadcrumb\",\"itemListElement\":[{\"@type\":\"ListItem\",\"position\":1,\"name\":\"Data Observability\",\"item\":\"https://www.integrate.io/docs/cdc/category/data-observability\"},{\"@type\":\"ListItem\",\"position\":2,\"name\":\"Data observability metrics in ELT \u0026 CDC\",\"item\":\"https://www.integrate.io/docs/cdc/data-observability-metrics\"}]},{\"@type\":[\"Article\",\"TechArticle\"],\"@id\":\"https://www.integrate.io/docs/cdc/data-observability-metrics#article\",\"headline\":\"Data observability metrics in ELT \u0026 CDC\",\"name\":\"Data observability metrics in ELT \u0026 CDC\",\"description\":\"Define and configure Data Observability metrics in Integrate.io. Track data quality measures for your warehouse tables and pipeline outputs.\",\"url\":\"https://www.integrate.io/docs/cdc/data-observability-metrics\",\"mainEntityOfPage\":{\"@id\":\"https://www.integrate.io/docs/cdc/data-observability-metrics#webpage\"},\"dateModified\":\"2026-10-27T23:24:44.000Z\",\"publisher\":{\"@id\":\"https://www.integrate.io/#organization\"},\"isPartOf\":{\"@id\":\"https://www.integrate.io/docs#website\"}}]}\u003c/script>\u003cscript data-mint-head type=\"application/ld+json\">{\"@context\":\"https://schema.org\",\"@type\":\"WebSite\",\"name\":\"Integrate.io\",\"publisher\":{\"@type\":\"Organization\",\"name\":\"Integrate.io\"},\"provider\":{\"@type\":\"Organization\",\"name\":\"Mintlify\",\"url\":\"https://mintlify.com\"}}\u003c/script>","agentPointerHref":"/docs/cdc/data-observability-metrics.md","siteName":"Integrate.io","nav":{"global":{"anchors":[{"anchor":"Contact Us","icon":"headset","href":"mailto:support@integrate.io"},{"anchor":"Blog","icon":"newspaper","href":"https://www.integrate.io/blog/"}]},"languages":[{"language":"en","default":true,"products":[{"product":"ETL \u0026 Reverse ETL","pages":[{"title":"ETL \u0026 Reverse ETL","href":"/etl"}]},{"product":"ELT \u0026 CDC","tabs":[{"tab":"Home","icon":"house","pages":[{"title":"Home","href":"/cdc"}]},{"tab":"Knowledge Base","icon":"book-open","groups":[{"group":"Getting Started","icon":"gear","pages":[{"title":"ELT/CDC: Getting Started","sidebarTitle":"ELT/CDC: Getting Started Overview","href":"/cdc/category/getting-started"},{"title":"What is Integrate.io ELT \u0026 CDC","sidebarTitle":"ELT/CDC: What is Integrate.io ELT \u0026 CDC","href":"/cdc/what-is-integrateio-cdc"},{"title":"ELT/CDC: Initial Sync Process","sidebarTitle":"ELT/CDC: Initial Sync Process","href":"/cdc/initial-sync-process"},{"title":"ELT/CDC: Custom Primary Key Feature","sidebarTitle":"ELT/CDC: Custom Primary Key Feature","href":"/cdc/custom-primary-key-feature"},{"title":"ELT/CDC: Auto Sync New Tables Feature","sidebarTitle":"ELT/CDC: Auto Sync New Tables Feature","href":"/cdc/auto-sync-new-tables-feature"},{"title":"ELT/CDC: Auto Sync New Columns Feature","sidebarTitle":"ELT/CDC: Auto Sync New Columns Feature","href":"/cdc/auto-sync-new-columns-feature"},{"title":"ELT/CDC: Keep Loading Healthy Tables Feature","sidebarTitle":"ELT/CDC: Keep Loading Healthy Tables Feature","href":"/cdc/keep-loading-healthy-tables-feature"},{"title":"ELT/CDC: How Integrate.io ELT \u0026 CDC Handles Schema Changes","sidebarTitle":"ELT/CDC: Schema Changes","href":"/cdc/how-integrateio-elt-cdc-handles-schema-changes"},{"title":"ELT/CDC: Archiving Unused Source and Destination","sidebarTitle":"ELT/CDC: Archiving Unused Source and Destination","href":"/cdc/archiving-unused-source-and-destination"},{"title":"ELT/CDC: History Mode (SCD Type 2)","sidebarTitle":"ELT/CDC: History Mode (SCD Type 2)","href":"/cdc/history-mode-scd-type-2"},{"title":"ELT/CDC: ELT \u0026 CDC Features and Requirements","sidebarTitle":"ELT/CDC: ELT \u0026 CDC Features and Requirements","href":"/cdc/elt-cdc-features-and-requirements"},{"title":"ELT/CDC: Surrogate Key (_iio_id)","sidebarTitle":"ELT/CDC: Surrogate Key (_iio_id)","href":"/cdc/surrogate-key-_iio_id"},{"title":"ELT/CDC: Managing Account Users","sidebarTitle":"ELT/CDC: Managing Account Users","href":"/cdc/managing-account-users"}]},{"group":"Pipelines","icon":"diagram-project","pages":[{"title":"ELT/CDC: Pipeline definition import and export","sidebarTitle":"ELT/CDC: Pipeline Definition Import/Export","href":"/cdc/pipeline-definition-import-export"}]},{"group":"Sources","icon":"server","pages":[{"title":"ELT/CDC: Sources","sidebarTitle":"ELT/CDC: Sources Overview","href":"/cdc/category/sources"},{"title":"Adobe Analytics source for ELT \u0026 CDC","sidebarTitle":"ELT/CDC: Adobe Analytics","href":"/cdc/adobe-analytics"},{"title":"AdRoll source for ELT \u0026 CDC","sidebarTitle":"ELT/CDC: AdRoll","href":"/cdc/adroll"},{"title":"Airtable source for ELT \u0026 CDC","sidebarTitle":"ELT/CDC: Airtable","href":"/cdc/airtable"},{"title":"Algolia source for ELT \u0026 CDC","sidebarTitle":"ELT/CDC: Algolia","href":"/cdc/algolia"},{"title":"Amazon Ads source for ELT \u0026 CDC","sidebarTitle":"ELT/CDC: Amazon Ads","href":"/cdc/amazon-ads"},{"title":"Amazon Marketplace source for ELT \u0026 CDC","sidebarTitle":"ELT/CDC: Amazon Marketplace","href":"/cdc/amazon-marketplace"},{"title":"BigCommerce source for ELT \u0026 CDC","sidebarTitle":"ELT/CDC: BigCommerce","href":"/cdc/bigcommerce"},{"title":"BigQuery source for ELT \u0026 CDC","sidebarTitle":"ELT/CDC: BigQuery","href":"/cdc/bigquery-source"},{"title":"Bing Ads source for ELT \u0026 CDC","sidebarTitle":"ELT/CDC: Bing Ads","href":"/cdc/bing-ads"},{"title":"Braintree source for ELT \u0026 CDC","sidebarTitle":"ELT/CDC: Braintree","href":"/cdc/braintree"},{"title":"Cybersource source for ELT \u0026 CDC","sidebarTitle":"ELT/CDC: Cybersource","href":"/cdc/cybersource"},{"title":"Delighted source for ELT \u0026 CDC","sidebarTitle":"ELT/CDC: Delighted","href":"/cdc/delighted"},{"title":"Drip source for ELT \u0026 CDC","sidebarTitle":"ELT/CDC: Drip","href":"/cdc/drip"},{"title":"eBay source for ELT \u0026 CDC","sidebarTitle":"ELT/CDC: eBay","href":"/cdc/ebay"},{"title":"EnquireLabs source for ELT \u0026 CDC","sidebarTitle":"ELT/CDC: EnquireLabs","href":"/cdc/enquirelabs"},{"title":"ExchangeRates source for ELT \u0026 CDC","sidebarTitle":"ELT/CDC: ExchangeRates","href":"/cdc/exchangerates"},{"title":"Facebook Ads source for ELT \u0026 CDC","sidebarTitle":"ELT/CDC: Facebook Ads","href":"/cdc/facebook-ads"},{"title":"Facebook Pages source for ELT \u0026 CDC","sidebarTitle":"ELT/CDC: Facebook Pages","href":"/cdc/facebook-pages"},{"title":"GitHub source for ELT \u0026 CDC","sidebarTitle":"ELT/CDC: GitHub","href":"/cdc/github"},{"title":"GitLab source for ELT \u0026 CDC","sidebarTitle":"ELT/CDC: GitLab","href":"/cdc/gitlab"},{"title":"Google Ads source for ELT \u0026 CDC","sidebarTitle":"ELT/CDC: Google Ads","href":"/cdc/google-ads"},{"title":"Google Ads change log v23 source for ELT \u0026 CDC","sidebarTitle":"ELT/CDC: Google Ads Change Log","href":"/cdc/google-ads-change-log-v23"},{"title":"Google Analytics source for ELT \u0026 CDC","sidebarTitle":"ELT/CDC: Google Analytics","href":"/cdc/google-analytics"},{"title":"Google Analytics 360 source for ELT \u0026 CDC","sidebarTitle":"ELT/CDC: Google Analytics 360 (GA360)","href":"/cdc/google-analytics-360-ga360"},{"title":"Google Analytics 4 source for ELT \u0026 CDC","sidebarTitle":"ELT/CDC: Google Analytics 4","href":"/cdc/google-analytics-4"},{"title":"Google Analytics 4 export source for ELT \u0026 CDC","sidebarTitle":"ELT/CDC: Google Analytics 4 Export (GA4 Export)","href":"/cdc/google-analytics-4-export-ga4-export"},{"title":"Google Search Console source for ELT \u0026 CDC","sidebarTitle":"ELT/CDC: Google Search Console","href":"/cdc/google-search-console"},{"title":"Google Sheets source for ELT \u0026 CDC","sidebarTitle":"ELT/CDC: Google Sheets","href":"/cdc/google-sheets"},{"title":"Gorgias source for ELT \u0026 CDC","sidebarTitle":"ELT/CDC: Gorgias","href":"/cdc/gorgias"},{"title":"HubSpot source for ELT \u0026 CDC","sidebarTitle":"ELT/CDC: HubSpot","href":"/cdc/hubspot"},{"title":"IBM DB2 source for ELT \u0026 CDC","sidebarTitle":"ELT/CDC: IBM DB2","href":"/cdc/ibm-db2"},{"title":"Intercom source for ELT \u0026 CDC","sidebarTitle":"ELT/CDC: Intercom","href":"/cdc/intercom"},{"title":"JudgeMe source for ELT \u0026 CDC","sidebarTitle":"ELT/CDC: JudgeMe","href":"/cdc/judgeme"},{"title":"Klaviyo source for ELT \u0026 CDC","sidebarTitle":"ELT/CDC: Klaviyo","href":"/cdc/klaviyo"},{"title":"LinkedIn Ads source for ELT \u0026 CDC","sidebarTitle":"ELT/CDC: LinkedIn Ads","href":"/cdc/linkedin-ads"},{"title":"Microsoft SQL Server source for ELT \u0026 CDC","sidebarTitle":"ELT/CDC: Microsoft SQL Server","href":"/cdc/microsoft-sql-server"},{"title":"MySQL source for ELT \u0026 CDC","sidebarTitle":"ELT/CDC: MySQL","href":"/cdc/mysql"},{"title":"Amazon RDS MySQL source for ELT \u0026 CDC","sidebarTitle":"ELT/CDC: MySQL - Amazon RDS MySQL","href":"/cdc/amazon-rds-mysql"},{"title":"Aurora MySQL source for ELT \u0026 CDC","sidebarTitle":"ELT/CDC: MySQL - Aurora MySQL","href":"/cdc/aurora-mysql"},{"title":"Azure MySQL source for ELT \u0026 CDC","sidebarTitle":"ELT/CDC: Azure MySQL","href":"/cdc/azure-mysql"},{"title":"Google Cloud SQL MySQL source for ELT \u0026 CDC","sidebarTitle":"ELT/CDC: Google Cloud SQL MySQL","href":"/cdc/google-cloud-sql"},{"title":"Self-hosted MySQL source for ELT \u0026 CDC","sidebarTitle":"ELT/CDC: MySQL - Self-hosted MySQL","href":"/cdc/self-hosted-mysql"},{"title":"NetSuite source for ELT \u0026 CDC","sidebarTitle":"ELT/CDC: NetSuite","href":"/cdc/netsuite"},{"title":"Onfleet source for ELT \u0026 CDC","sidebarTitle":"ELT/CDC: Onfleet","href":"/cdc/onfleet"},{"title":"Pinterest source for ELT \u0026 CDC","sidebarTitle":"ELT/CDC: Pinterest","href":"/cdc/pinterest"},{"title":"Oracle CDC source for ELT \u0026 CDC","sidebarTitle":"ELT/CDC: Oracle CDC","href":"/cdc/oracle-cdc"},{"title":"AWS RDS Oracle source for ELT \u0026 CDC","sidebarTitle":"ELT/CDC: AWS RDS Oracle","href":"/cdc/aws-rds-oracle"},{"title":"Self-hosted Oracle CDC source for ELT \u0026 CDC","sidebarTitle":"ELT/CDC: Oracle CDC - Self-hosted","href":"/cdc/oracle-cdc-self-hosted"},{"title":"PostgreSQL source for ELT \u0026 CDC","sidebarTitle":"ELT/CDC: PostgreSQL","href":"/cdc/postgresql"},{"title":"Aurora PostgreSQL source for ELT \u0026 CDC","sidebarTitle":"ELT/CDC: Aurora PostgreSQL","href":"/cdc/aurora-postgresql"},{"title":"Amazon RDS PostgreSQL source for ELT \u0026 CDC","sidebarTitle":"ELT/CDC: PostgreSQL - Amazon RDS PostgreSQL","href":"/cdc/amazon-rds-postgresql"},{"title":"Azure PostgreSQL source for ELT \u0026 CDC","sidebarTitle":"ELT/CDC: PostgreSQL - Azure PostgreSQL","href":"/cdc/azure-postgresql"},{"title":"Self-hosted PostgreSQL source for ELT \u0026 CDC","sidebarTitle":"ELT/CDC: Self-hosted PostgreSQL","href":"/cdc/self-hosted-postgresql"},{"title":"Google Cloud SQL PostgreSQL source for ELT \u0026 CDC","sidebarTitle":"ELT/CDC: Google Cloud SQL for PostgreSQL","href":"/cdc/google-cloud-sql-for-posgresql"},{"title":"Intuit Quickbooks source for ELT \u0026 CDC","sidebarTitle":"ELT/CDC: Intuit Quickbooks","href":"/cdc/quickbooks"},{"title":"ReCharge source for ELT \u0026 CDC","sidebarTitle":"ELT/CDC: ReCharge","href":"/cdc/recharge"},{"title":"S3 source for ELT \u0026 CDC","sidebarTitle":"ELT/CDC: S3","href":"/cdc/s3-source"},{"title":"Salesforce source for ELT \u0026 CDC","sidebarTitle":"ELT/CDC: Salesforce","href":"/cdc/salesforce"},{"title":"Shippo source for ELT \u0026 CDC","sidebarTitle":"ELT/CDC: Shippo","href":"/cdc/shippo"},{"title":"Shopify source for ELT \u0026 CDC","sidebarTitle":"ELT/CDC: Shopify","href":"/cdc/shopify"},{"title":"Snapchat source for ELT \u0026 CDC","sidebarTitle":"ELT/CDC: Snapchat","href":"/cdc/snapchat"},{"title":"Square source for ELT \u0026 CDC","sidebarTitle":"ELT/CDC: Square","href":"/cdc/square"},{"title":"Stripe source for ELT \u0026 CDC","sidebarTitle":"ELT/CDC: Stripe","href":"/cdc/stripe"},{"title":"Tiktok Ads source for ELT \u0026 CDC","sidebarTitle":"ELT/CDC: Tiktok Ads","href":"/cdc/tiktok-ads"},{"title":"Yotpo source for ELT \u0026 CDC","sidebarTitle":"ELT/CDC: Yotpo","href":"/cdc/yotpo"},{"title":"Zenventory source for ELT \u0026 CDC","sidebarTitle":"ELT/CDC: Zenventory","href":"/cdc/zenventory"}]},{"group":"Destinations","icon":"sliders-up","pages":[{"title":"ELT/CDC: Destinations","sidebarTitle":"ELT/CDC: Destinations Overview","href":"/cdc/category/destinations"},{"title":"Amazon Redshift destination for ELT \u0026 CDC","sidebarTitle":"ELT/CDC: Amazon Redshift","href":"/cdc/amazon-redshift"},{"title":"ELT/CDC: Configure S3 bucket for Redshift sync","sidebarTitle":"ELT/CDC: Amazon Redshift - Configure your own S3 bucket for Redshift Sync","href":"/cdc/configure-your-own-s3-bucket-for-redshift-sync"},{"title":"Snowflake destination for ELT \u0026 CDC","sidebarTitle":"ELT/CDC: Snowflake","href":"/cdc/snowflake"},{"title":"Finding your Snowflake account identifier","sidebarTitle":"ELT/CDC: Snowflake Account Identifier","href":"/cdc/how-to-get-your-snowflake-account-identifier"},{"title":"ELT/CDC: Snowflake password to key-pair migration","sidebarTitle":"ELT/CDC: Migrating Snowflake Authentication from Password to Key-Pair","href":"/cdc/migrating-authentication-from-password-to-key-pair"},{"title":"Amazon S3 destination bucket setup for ELT \u0026 CDC","sidebarTitle":"ELT/CDC: Amazon S3 Setting up your Bucket","href":"/cdc/s3-destination"},{"title":"BigQuery destination for ELT \u0026 CDC","sidebarTitle":"ELT/CDC: BigQuery","href":"/cdc/bigquery"},{"title":"MySQL destination for ELT \u0026 CDC","sidebarTitle":"ELT/CDC: MySQL Destination","href":"/cdc/mysql-destination"},{"title":"SQL Server destination for ELT \u0026 CDC","sidebarTitle":"ELT/CDC: SQL Server Destination","href":"/cdc/sqlserver-destination"},{"title":"Databricks destination for ELT \u0026 CDC","sidebarTitle":"ELT/CDC: Databricks","href":"/cdc/databricks"}]},{"group":"Monitoring","icon":"laptop-code","pages":[{"title":"ELT/CDC: Monitoring","sidebarTitle":"ELT/CDC: Monitoring Overview","href":"/cdc/category/monitoring"},{"title":"Data type mapping across warehouses in ELT \u0026 CDC","sidebarTitle":"ELT/CDC: Monitoring - Data Type Mapping","href":"/cdc/data-type-mapping-redshift-snowflake-and-bigquery"},{"title":"Data type mapping for Redshift in ELT \u0026 CDC","sidebarTitle":"ELT/CDC: Monitoring - Data Type Mapping - Redshift","href":"/cdc/data-type-mapping-redshift"},{"title":"Data type changes for Redshift in ELT \u0026 CDC","sidebarTitle":"ELT/CDC: Monitoring - Data Type Changes - Redshift","href":"/cdc/data-type-changes-redshift"},{"title":"Data type mapping for Snowflake in ELT \u0026 CDC","sidebarTitle":"ELT/CDC: Monitoring - Data Type Mapping - Snowflake","href":"/cdc/data-type-mapping-snowflake"},{"title":"Data type changes for Snowflake in ELT \u0026 CDC","sidebarTitle":"ELT/CDC: Monitoring - Data Type Changes - Snowflake","href":"/cdc/data-type-changes-snowflake"},{"title":"Data type mapping for BigQuery in ELT \u0026 CDC","sidebarTitle":"ELT/CDC: Monitoring - Data Type Mapping - BigQuery","href":"/cdc/data-type-mapping-bigquery"},{"title":"ELT/CDC: Hooks for monitoring","sidebarTitle":"Monitoring - Hooks","href":"/cdc/hooks"},{"title":"ELT/CDC: Monitoring Salesforce Pipelines","sidebarTitle":"ELT/CDC: Monitoring - Salesforce","href":"/cdc/salesforce-monitoring"}]},{"group":"Security","icon":"badge-check","pages":[{"title":"ELT/CDC: Security","sidebarTitle":"ELT/CDC: Security","href":"/cdc/category/security"},{"title":"IP allowlist for ELT \u0026 CDC","sidebarTitle":"ELT/CDC: Security - IP List","href":"/cdc/ip-list"},{"title":"PrivateLink setup for MySQL in ELT \u0026 CDC","sidebarTitle":"ELT/CDC: Security - PrivateLink setup for MySQL","href":"/cdc/privatelink-set-up"},{"title":"PrivateLink setup for PostgreSQL in ELT \u0026 CDC","sidebarTitle":"ELT/CDC: Security - PrivateLink setup for PostgreSQL","href":"/cdc/postgresql-privatelink-set-up"},{"title":"SSH tunnel setup for ELT \u0026 CDC","sidebarTitle":"ELT/CDC: Security - SSH Tunnel","href":"/cdc/ssh-tunnel"},{"title":"Reverse SSH tunnel for ELT \u0026 CDC","sidebarTitle":"ELT/CDC: Security - Reverse SSH Tunnel","href":"/cdc/reverse-ssh-tunnel"},{"title":"Google API privacy policy for ELT \u0026 CDC","sidebarTitle":"ELT/CDC: Security - Google Privacy Policy","href":"/cdc/google-privacy-policy"}]},{"group":"Transforms","icon":"gear","pages":[{"title":"ELT/CDC: Transforms","sidebarTitle":"ELT/CDC: Transforms","href":"/cdc/category/transforms"},{"title":"Replacement rules transform in ELT \u0026 CDC","sidebarTitle":"ELT/CDC: Transforms - Replacement Rules","href":"/cdc/replacement-rules"}]},{"group":"Data Observability","icon":"clipboard-list-check","pages":[{"title":"ELT/CDC: Data Observability","sidebarTitle":"ELT/CDC: Data Observability Overview","href":"/cdc/category/data-observability"},{"title":"ELT/CDC: What is Data Observability","sidebarTitle":"ELT/CDC: What is Data Observability","href":"/cdc/what-is-data-observability"},{"title":"Data observability nomenclature in ELT \u0026 CDC","sidebarTitle":"ELT/CDC: Nomenclature","href":"/cdc/nomenclature"},{"title":"Getting started with data observability","sidebarTitle":"ELT/CDC: Getting Started","href":"/cdc/data-observability-getting-started"},{"title":"Data observability alerts in ELT \u0026 CDC","description":"Set up Data Observability alerts in Integrate.io to automatically monitor data quality. Configure metric thresholds and notification rules.","sidebarTitle":"ELT/CDC: Alerts","href":"/cdc/data-observability-alerts"},{"title":"Data observability metrics in ELT \u0026 CDC","sidebarTitle":"ELT/CDC: Metrics","jp_link":"/jp/etl/category/japanese-knowledge-base","ko_link":"/ko/etl/category/korean-knowledge-base","href":"/cdc/data-observability-metrics"},{"title":"ELT/CDC: Available Metrics Types","sidebarTitle":"ELT/CDC: Available Metrics Types","description":"Explore the available metric types in Integrate.io ELT \u0026 CDC monitoring. Track replication delay, sync lag, and pipeline health indicators.","href":"/cdc/available-metrics-types"},{"title":"Replication delay metric in ELT \u0026 CDC","sidebarTitle":"ELT/CDC: Available Metrics Types - Replication Delay","href":"/cdc/available-metrics-types-replication-delay"},{"title":"Sync lag metric in ELT \u0026 CDC","sidebarTitle":"ELT/CDC: Available Metrics Types - Sync Lag Metric","href":"/cdc/available-metrics-types-sync-lag-metric"},{"title":"Data stores in ELT \u0026 CDC observability","sidebarTitle":"ELT/CDC: Data Stores","href":"/cdc/data-stores"},{"title":"Data observability FAQs in ELT \u0026 CDC","sidebarTitle":"ELT/CDC: FAQs","href":"/cdc/data-observability-faqs"}]}]},{"tab":"API Reference","icon":"code-simple","pages":[{"title":"API Reference","href":"/api-reference/pipelines/list-pipelines"}]}]}]},{"language":"ko","pages":[{"title":"ko","href":"/ko/etl/category/korean-knowledge-base"}]},{"language":"jp","pages":[{"title":"jp","href":"/jp/etl/category/japanese-knowledge-base"}]}]},"basePath":"","title":"Data observability metrics in ELT \u0026 CDC - Integrate.io","deploymentId":"dpl_53YqbBPsHdrqSGqXiWPGU7csRVod","buildId":"dpl_53YqbBPsHdrqSGqXiWPGU7csRVod","dynamics":["07c022d89b","a74be98ba7"],"chunks":["Frame-BrWhOrIJ.js","DynamicMarkdown-CsgNpZb1.js","zoom-image-lightbox-BVW4Axcm.js","lightbox-handle-r17bVUz3.js"]}